Explore A/B tests run by Blend Commerce on real Shopify stores, covering product pages, collection pages, cart, checkout and mobile navigation. Review the hypotheses, compare the original and tested versions, and explore the results for conversion rate, average order value and revenue per visitor. Learn from our CRO strategists’ findings to help decide what to test on your own store.

Cart & Checkout
40.37% Increase in Revenue per Visitor
Changing the copy of one sentence increased Conversion Rates, Revenue per Visitor, Average Order Value, and Checkout Visits in one go.
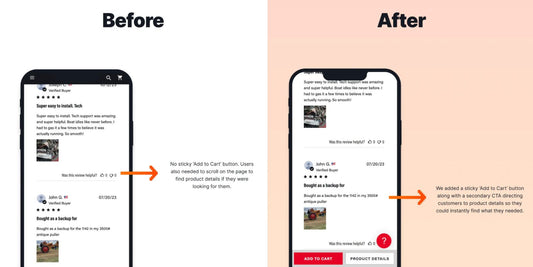
Product Page (PDP)
10% increase in Conversion Rate
The first fold makes an impact. We found out how much when we optimised the PDP fold of a client to see increases in Conversion Rates and Clicks on Cart,...
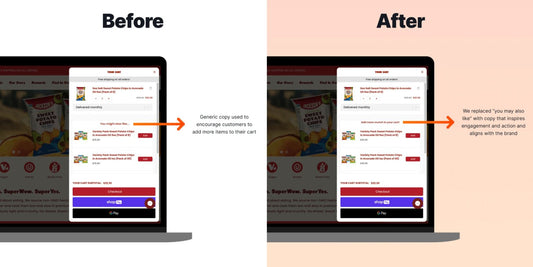
Cart & Checkout
83% increase in Product Additions in Smart Cart
This one optimisation to the cart made a big impact on how many customers added additional products to their cart—within the cart.
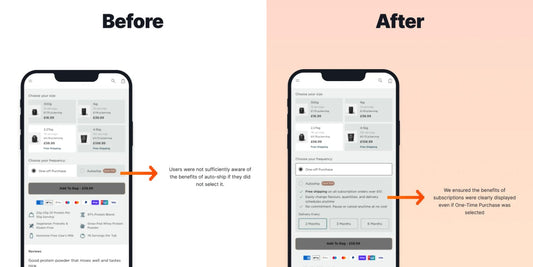
Product Page (PDP)
104% increase in Auto-Ship Selection
When looking to increase Subscription Rates, this one change increased that plus the Add to Cart Rate and Conversion Rates.
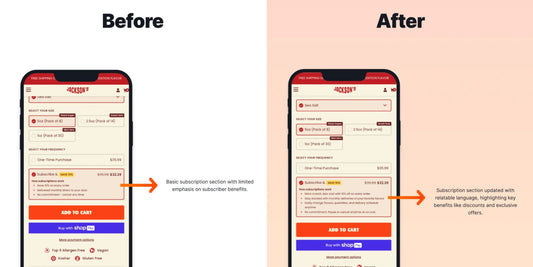
Product Page (PDP)
6% increase in Subscription Rate
Tweaking the copy on-site to make them more relatable made a large impact on Subscription Rates, Average Order Values, and Conversion Rates.
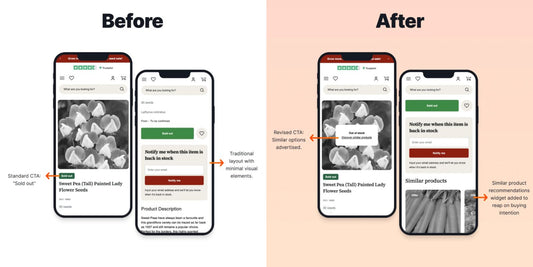
Product Page (PDP)
4.59% increase in Conversion Rate
When displaying alternative options to Out of Stock products, we saw an increase in Conversion Rates and Revenue per Visitor.
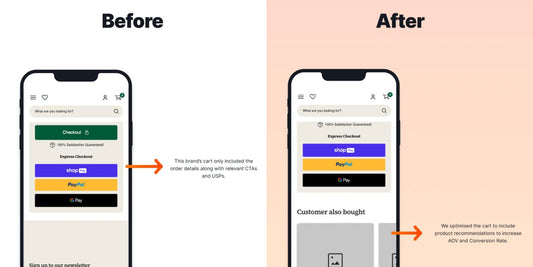
Cart & Checkout
43% increase in Revenue
Making the cart process as easy as possible saw an increase in Revenue, Cart Completion Rate, and Conversion Rate.
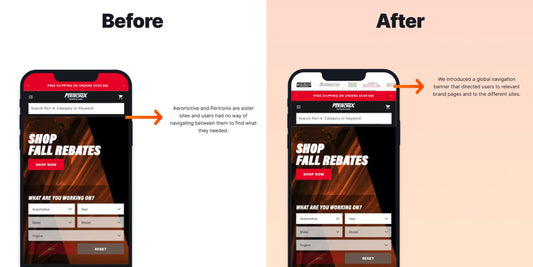
Other
46.84% increase in Conversion Rate
What if switching between sister sites could drive more sales? This test delivered a 46.84% conversion lift for PerTronix and up to 49% more revenue per user.
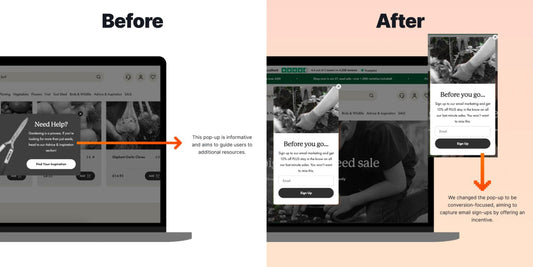
Other
4% increase in Average Order Value
Testing pop-ups is important. So important that this test saw an increase in Average Order Value, Conversion Rate, and Interactions with the Pop-Up itself.
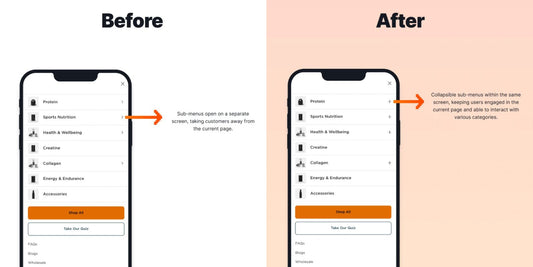
Search & Navigation
7.25% increase in Conversion Rate
Ensuring the customer experience is as smooth as possible, even in the most simple formats, saw an increase in Conversion Rates, Revenue per Visitor, and Subcategory Clicks.
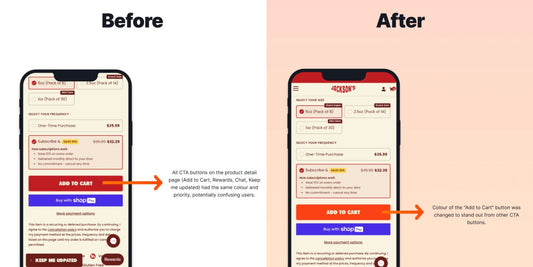
Product Page (PDP)
18.40% increase in Conversion Rate
Could a colour change improve conversions? This A/B test drove an 18.40% conversion lift and higher AOV for new visitors. See how it influenced user behaviour!
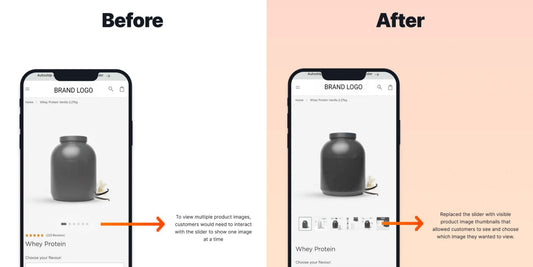
Product Page (PDP)
7.17% increase in Conversion Rate
Could a simple tweak to product pages drive more sales? This A/B test revealed a 7.17% uplift in conversion rate and higher revenue per visitor. See how!
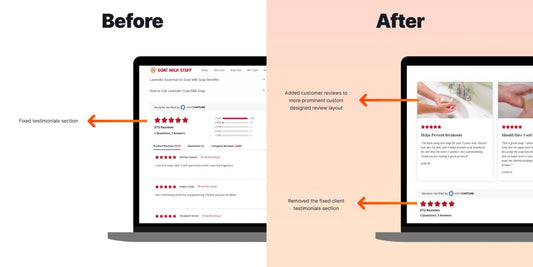
Product Page (PDP)
3.61% increase in Conversion Rate
An A/B test on review imagery improved engagement and trust on PDPs, leading to a 3.61% increase in conversion rate and 5% more Add to Cart clicks.
Cart & Checkout
37% increase in Conversion Rate
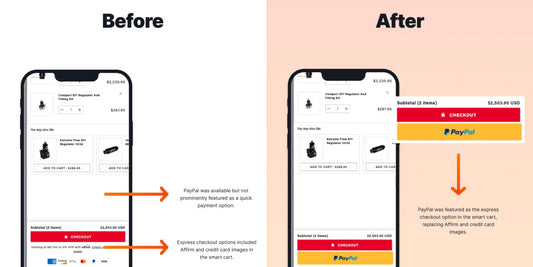
Replacing Affirm and credit card logos with a PayPal Express button in the Rebuy Smart Cart led to a 37% conversion rate lift, plus AOV & revenue per user gains.
Other
32% increase in Conversion Rate
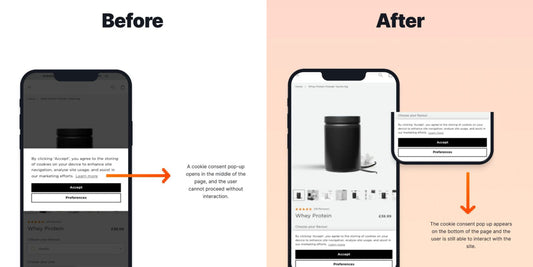
We tested cookie consent placements, aiming to reduce friction and uncover hidden user behaviour. Surprisingly different outcomes guided a region-specific rollout, driving notable lifts in key eCommerce metrics.
Cart & Checkout
6% increase in Conversion Rate
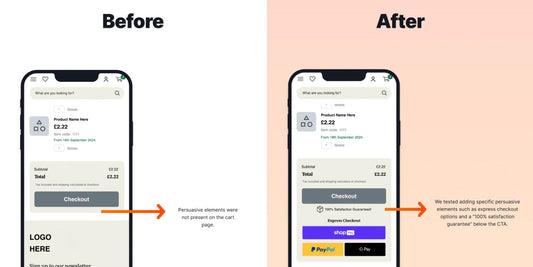
Data analysis shows express checkout driving customer payment choices, with a surprising surge in PayPal usage. Uncover the strategic tweaks behind our bold permanent Variant 1 rollout.
Product Page (PDP)
17.26% increase in Average Order Value
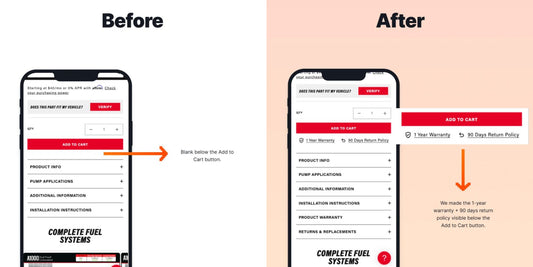
Search queries revealed a demand for clearer support info, driving us to test enhancements like free shipping, money-back guarantees, and detailed policies. Our A/B/C test confirmed that highlighting guarantee policies on...

Search & Navigation
45% increase in AOV for Returning Customers
Exposing the mobile search bar tapped into high-intent shoppers while unveiling intriguing insights about returning visitors. A small fraction of overall traffic drove a striking share of revenue, hinting at a...

Product Page (PDP)
15.21% increase in Conversion Rate
Reorganising critical product details helped shoppers find information faster and boosted engagement. The resulting lift in conversions and SEO signals that small design shifts can drive big impacts.

Search & Navigation
17.45% increase in Conversion Rate
Exposing the mobile search bar tapped into the strong buying intent of shoppers who already knew exactly what they wanted. Our findings hint at a game-changing boost in engagement and conversions,...

Cart & Checkout
35% increase in Conversion Rate
Integrating express checkout into the Smart Cart spurred a 35% conversion surge and skyrocketed clicks on Shop Pay, Google Pay, and Apple Pay. Striking gains like these redefined the customer journey...

Search & Navigation
88% increase in Conversion Rate
Our analysis revealed that mobile users with high purchase intent benefit greatly from a smoother search experience. Our Variant drove a 126% increase in search engagement along with significant boosts in...
Frequently Asked Questions About Shopify A/B Testing
How do you run A/B tests on Shopify?
A/B testing on Shopify on Shopify involves showing two versions of a page, element, or feature to different segments of your visitors at the same time. We use Intelligems to split traffic accurately, track performance, and measure statistically significant differences in conversion rate, AOV, revenue per user, and other key metrics.
Every test follows a clear process:
- Analyse data to identify a problem
- Create a hypothesis
- Design the variant (UI, UX, copy, layout, pricing, etc.)
- Code and QA the test
- Split traffic accurately
- Run until the pre-agreed sample size, duration and stopping rule are met
- Review results, insights, and recommendations
When a test wins, we help you publish the variant to your live theme quickly and safely.
What makes a good A/B test hypothesis?
A strong hypothesis clearly states what you’re changing, who it affects, and what outcome you expect based on data.
For example:
“Because users aren’t seeing product benefits above the fold on PDPs, adding a benefit bar will help visitors understand value faster and increase add-to-cart rate.”
Good hypotheses come from real behavioural data, not guesswork and they connect the opportunity to a measurable outcome. Our marketing experiment guide covers the full question, evidence, hypothesis, method, metric and decision-rule structure.
How long should a Shopify A/B test run?
Two to four weeks is common, but duration is not fixed. It depends on eligible traffic, baseline conversion rate, minimum detectable effect, the number of variants and traffic allocation.
We plan the sample size, duration and stopping rule before launch. If the planned sample is not reached by the expected end date, we decide whether an extension is justified or report the result as inconclusive. A variant leading part-way through the test is not, by itself, a reason to stop early.
We avoid running tests during major promotional periods such as BFCM because sudden changes in traffic and buyer intent can distort the result.
What's the best A/B testing tool for Shopify?
Intelligems is our preferred A/B testing platform for Shopify because it’s accurate, fast, and built specifically for testing things like pricing, free shipping thresholds, subscriptions, and revenue-based metrics. It also integrates seamlessly with Shopify, which keeps the testing experience stable and reliable.
That said, several tools work well depending on what you want to test:
- Intelligems → best for pricing, thresholds, subscriptions, and revenue-driven Shopify tests
- Convert → solid for UX and design tests
- Shoplift → Shopify-native and quick to deploy UI experiments
- Omniconvert → strong for surveys, segmentation, and personalisation
- VWO (Visual Website Optimizer) → flexible enterprise-level testing
Do A/B tests work with low traffic?
Conventional A/B tests need enough eligible traffic and conversions to have a reasonable chance of producing a conclusive result. Blend typically recommends a minimum of 50,000 monthly sessions as a guideline for conventional A/B testing. It is not a hard rule or a universal statistical-significance cutoff, and we assess each proposed split test individually based on the traffic and conversions available to that test.
CRO can be used at any traffic level. Where a split test is not viable, we use other evidence-led methods such as user testing, heatmap and behavioural analysis, heuristic CRO reviews and iterative UX improvements. These methods can still guide decisions without relying on an underpowered split test.
What metrics should I track during A/B testing?
Metrics depend on what the test is designed to improve. Common primary metrics include:
- eCommerce conversion rate
- Average order value (AOV)
- Revenue per visitor
- Subscription rate (if applicable)
- We also track supporting metrics like:
- Add to cart rate
- Bounce rate
- PDP visits
- Filter usag
- Interaction rates
This gives a full picture of why a variant won, not just whether it won.