Explore A/B tests run by Blend Commerce on real Shopify stores, covering product pages, collection pages, cart, checkout and mobile navigation. Review the hypotheses, compare the original and tested versions, and explore the results for conversion rate, average order value and revenue per visitor. Learn from our CRO strategists’ findings to help decide what to test on your own store.

Collection Page (PLP)
Utilising Story Widgets on Collection Pages
Does Using Story Widgets on Collection Pages Improve Subscription Conversions?
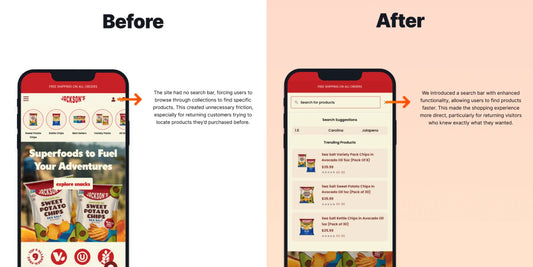
Search & Navigation
Implement a Search Bar
Does Adding a Search Bar Improve Conversion Rate for Returning Visitors?

Product Page (PDP)
Adding Key Value Propositions Below the Add to Cart Button
Does Adding Value Propositions Below ATC Improve PDP Conversion Rate?

Search & Navigation
Exposed Search Bar on Desktop
Could you improve Conversion Rates by exposing the Search Bar on Desktop?

Search & Navigation
Words with Icons in Navigation
Could Adding Words to Icons in the Mobile Nav Improve Conversion Rate?
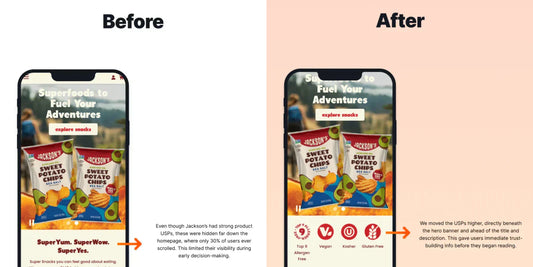
Homepage
Optimise USP Section on the Home Page
Does Moving USPs Higher on the Homepage Improve Conversion Rate?

Product Page (PDP)
66.18% Increase in Revenue per Visitor
Express Checkout buttons are often a CRO essential. Yet dropping them in this experiment cleared the path and unlocked a surprising jump in revenue per visitor.

Product Page (PDP)
32% Increase in Subscription Orders per Visitor
Adding a clear bullet-list of subscription perks nudged hesitant shoppers, lifting subscription orders per visit on desktop and 15% on mobile.
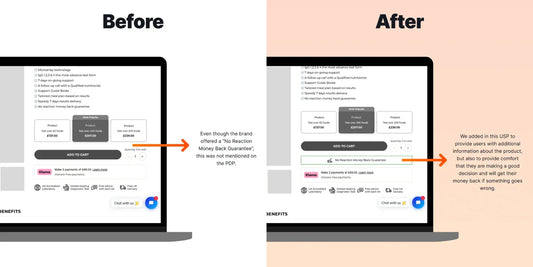
Product Page (PDP)
30.33% Increase in Conversion Rate
Placing a “No Reaction Money Back Guarantee” below the Add to Cart button drove trust and measurable uplifts in conversion for this wellness brand.

Search & Navigation
22% Increase in Conversion Rate
Find out how exposing the mobile search bar improved product discoverability and drove measurable uplifts in user engagement for this DTC casket brand.
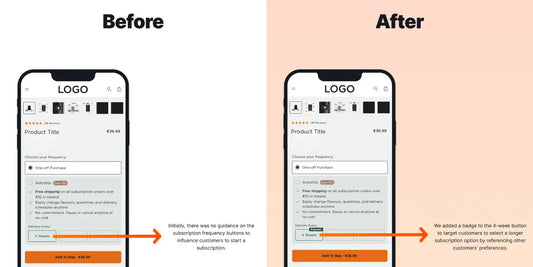
Product Page (PDP)
14.81% Increase in Conversion Rate
Adding “Popular” badges to subscription options nudged users toward Autoship and improved conversion, proving social proof outperforms brand recommendation when it comes to retention-focused PDP design.
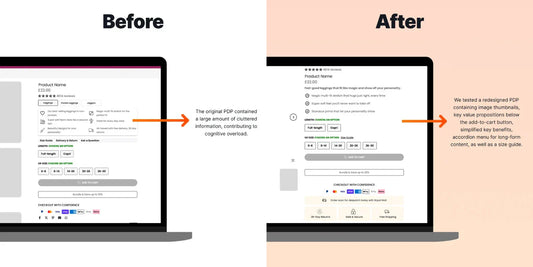
Product Page (PDP)
32% Increase in Conversion Rate for Desktop Devices
A full PDP redesign helped users find the info they needed faster, leading to more confident purchases, especially on desktop, where conversion rate jumped by over 30%.
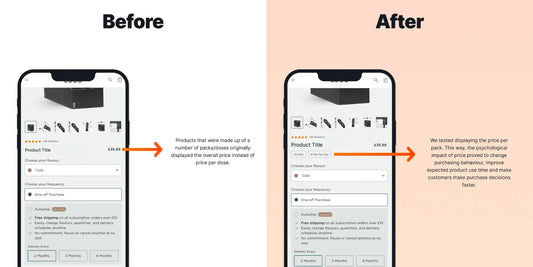
Product Page (PDP)
17.76% Increase in Revenue per Visitor
A subtle shift in how price was framed had a major impact. By highlighting cost per capsule, Blend helped users make faster decisions, leading to higher conversions, and more subscribers.

Product Page (PDP)
24% Increase in Conversion Rate
Find out how replacing tabbed options with open radio buttons improved clarity, reduced friction, and drove measurable uplifts in revenue for this DTC brand.

Homepage
38.1% Increase in Conversion Rate
When most of your traffic is new, your homepage needs to do more than just sell. We tested softening the initial CTA to reduce friction for first-time visitors. And the...
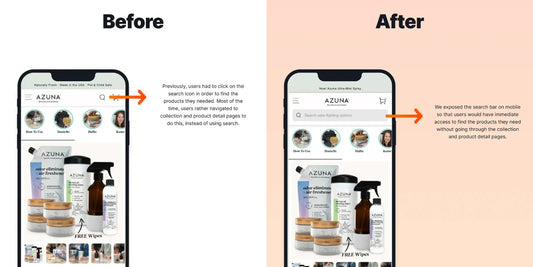
Search & Navigation
2.67% Increase in Profit per Visitor
Sometimes, the simplest changes have the biggest payoff. Exposing the search bar on mobile led to faster product discovery and smoother navigation, especially for returning users.
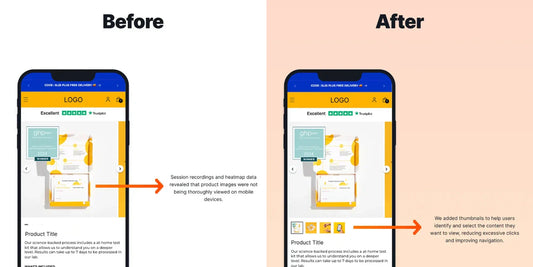
Product Page (PDP)
1.71% Increase in Conversion Rate
Heatmaps showed mobile users missed key product images. By introducing thumbnails, we created a clearer, more intuitive journey to purchase.

Product Page (PDP)
9% Increase in Conversion Rate
Subtle structural changes matter. Organising PDP content into an accordion helped reduce friction and drove a measurable revenue lift without compromising on key details.

Product Page (PDP)
4% Increase in Revenue per Visitor
Making scent selection easier with swatches helped increase conversion and revenue, while revealing new insights about subscription behaviour.
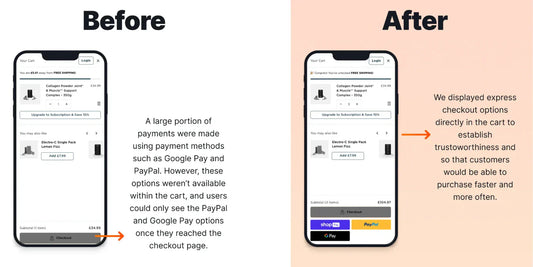
Cart & Checkout
26.2% Increase in Revenue per Visitor
Discover how adding express checkout options to the cart boosted revenue per visitor by 26.2% and drove a 53% uplift in mobile performance.

Search & Navigation
11.11% Increase in Revenue per Visitor
Discover how simplifying mobile navigation helped customers find products faster and transformed browsing into buying.
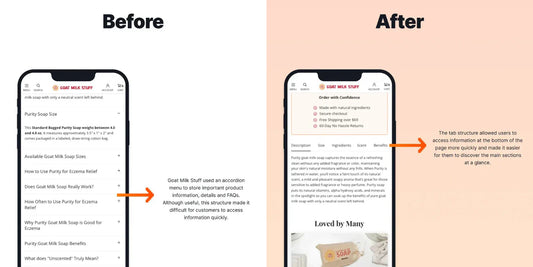
Product Page (PDP)
18.73% Increase in Revenue per Visitor
Testing the layout of information on the product detail page is important, as not all customers process information the same way. By tweaking the way these sections are presented, we...
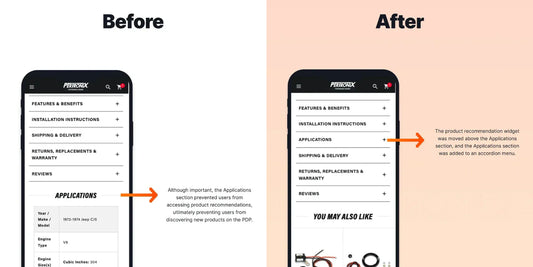
Product Page (PDP)
65.16% increase in Conversion Rate
Conducting an A/B/C test by simply shifting elements on the product detail page made large impacts on the Conversion Rates, Revenue per Visitor, and Add to Cart Rates of one...

Collection Page (PLP)
73.5% Increase in Average Order Value
Read how a small change can make wave-high impacts to increase Conversion Rates, Average Order Value, and Revenue per Visitor for one of our clients.
Frequently Asked Questions About Shopify A/B Testing
How do you run A/B tests on Shopify?
A/B testing on Shopify on Shopify involves showing two versions of a page, element, or feature to different segments of your visitors at the same time. We use Intelligems to split traffic accurately, track performance, and measure statistically significant differences in conversion rate, AOV, revenue per user, and other key metrics.
Every test follows a clear process:
- Analyse data to identify a problem
- Create a hypothesis
- Design the variant (UI, UX, copy, layout, pricing, etc.)
- Code and QA the test
- Split traffic accurately
- Run until the pre-agreed sample size, duration and stopping rule are met
- Review results, insights, and recommendations
When a test wins, we help you publish the variant to your live theme quickly and safely.
What makes a good A/B test hypothesis?
A strong hypothesis clearly states what you’re changing, who it affects, and what outcome you expect based on data.
For example:
“Because users aren’t seeing product benefits above the fold on PDPs, adding a benefit bar will help visitors understand value faster and increase add-to-cart rate.”
Good hypotheses come from real behavioural data, not guesswork and they connect the opportunity to a measurable outcome. Our marketing experiment guide covers the full question, evidence, hypothesis, method, metric and decision-rule structure.
How long should a Shopify A/B test run?
Two to four weeks is common, but duration is not fixed. It depends on eligible traffic, baseline conversion rate, minimum detectable effect, the number of variants and traffic allocation.
We plan the sample size, duration and stopping rule before launch. If the planned sample is not reached by the expected end date, we decide whether an extension is justified or report the result as inconclusive. A variant leading part-way through the test is not, by itself, a reason to stop early.
We avoid running tests during major promotional periods such as BFCM because sudden changes in traffic and buyer intent can distort the result.
What's the best A/B testing tool for Shopify?
Intelligems is our preferred A/B testing platform for Shopify because it’s accurate, fast, and built specifically for testing things like pricing, free shipping thresholds, subscriptions, and revenue-based metrics. It also integrates seamlessly with Shopify, which keeps the testing experience stable and reliable.
That said, several tools work well depending on what you want to test:
- Intelligems → best for pricing, thresholds, subscriptions, and revenue-driven Shopify tests
- Convert → solid for UX and design tests
- Shoplift → Shopify-native and quick to deploy UI experiments
- Omniconvert → strong for surveys, segmentation, and personalisation
- VWO (Visual Website Optimizer) → flexible enterprise-level testing
Do A/B tests work with low traffic?
Conventional A/B tests need enough eligible traffic and conversions to have a reasonable chance of producing a conclusive result. Blend typically recommends a minimum of 50,000 monthly sessions as a guideline for conventional A/B testing. It is not a hard rule or a universal statistical-significance cutoff, and we assess each proposed split test individually based on the traffic and conversions available to that test.
CRO can be used at any traffic level. Where a split test is not viable, we use other evidence-led methods such as user testing, heatmap and behavioural analysis, heuristic CRO reviews and iterative UX improvements. These methods can still guide decisions without relying on an underpowered split test.
What metrics should I track during A/B testing?
Metrics depend on what the test is designed to improve. Common primary metrics include:
- eCommerce conversion rate
- Average order value (AOV)
- Revenue per visitor
- Subscription rate (if applicable)
- We also track supporting metrics like:
- Add to cart rate
- Bounce rate
- PDP visits
- Filter usag
- Interaction rates
This gives a full picture of why a variant won, not just whether it won.