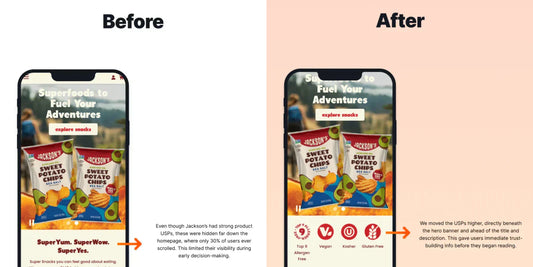
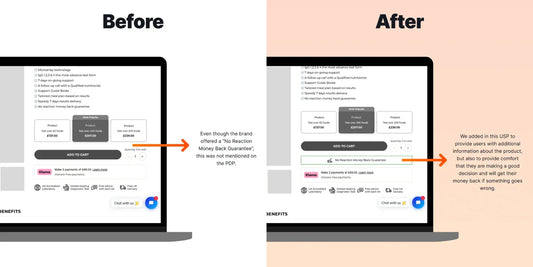
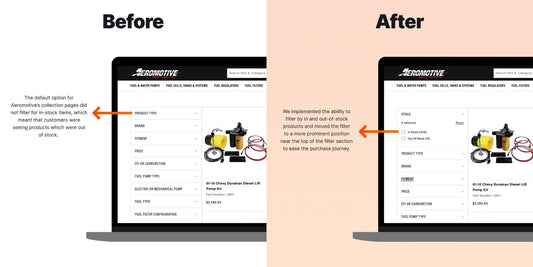
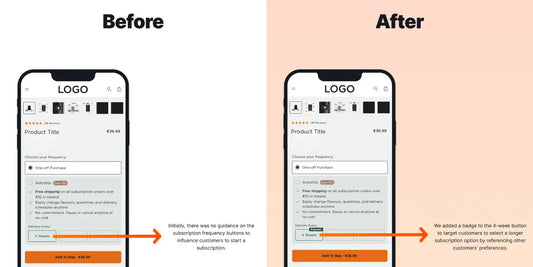
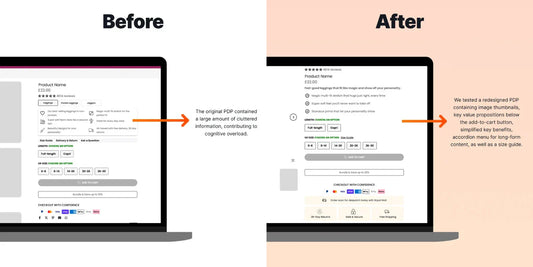
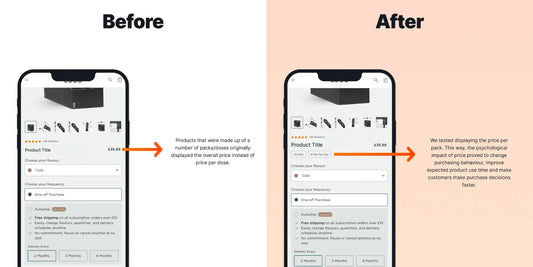
Explore proven A/B tests run on real Shopify stores complete with the data we used to find the opportunity, our hypotheses, the variants, and what the results actually mean. These CRO case studies show you the exact changes that drive higher conversion, AOV, and revenue.
Proven Shopify A/B Tests You Can Learn From
The Blend CRO Lens
How do you run A/B tests on Shopify?
A/B testing on Shopify involves showing two versions of a page, element, or feature to different segments of your visitors at the same time. We use Intelligems to split traffic accurately, track performance, and measure statistically significant differences in conversion rate, AOV, revenue per user, and other key metrics.
Every test follows a clear process:
- Analyse data to identify a problem
- Create a hypothesis
- Design the variant (UI, UX, copy, layout, pricing, etc.)
- Code and QA the test
- Split traffic accurately
- Run until statistical significance
- Review results, insights, and recommendations
When a test wins, we help you publish the variant to your live theme quickly and safely.
What makes a good A/B test hypothesis?
A strong hypothesis clearly states what you’re changing, who it affects, and what outcome you expect based on data.
For example:
“Because users aren’t seeing product benefits above the fold on PDPs, adding a benefit bar will help visitors understand value faster and increase add-to-cart rate.”
Good hypotheses come from real behavioural data, not guesswork and they connect the opportunity to a measurable outcome.
How long should a Shopify A/B test run?
Most Shopify tests run for 2–4 weeks, depending on traffic volume, seasonality, and how quickly each variant collects enough conversions.
We always run tests until they reach statistical significance, not just a fixed number of days.
If significance isn’t reached in two weeks, we extend the test.
If one variant is consistently leading and the data is strong, we may call a winner earlier.
We avoid running tests during major promotional periods (like BFCM), because spikes in traffic and buyer intent can distort the results.
What's the best A/B testing tool for Shopify?
Intelligems is our preferred A/B testing platform for Shopify because it’s accurate, fast, and built specifically for testing things like pricing, free shipping thresholds, subscriptions, and revenue-based metrics. It also integrates seamlessly with Shopify, which keeps the testing experience stable and reliable.
That said, several tools work well depending on what you want to test:
- Intelligems → best for pricing, thresholds, subscriptions, and revenue-driven Shopify tests
- Convert → solid for UX and design tests
- Shoplift → Shopify-native and quick to deploy UI experiments
- Omniconvert → strong for surveys, segmentation, and personalisation
- VWO (Visual Website Optimizer) → flexible enterprise-level testing
Do A/B tests work with low traffic.
A/B tests need a minimum level of traffic and conversions to reach statistical significance. The exact requirement depends on what you’re testing, but as a general guideline, most agencies recommend at least 50,000 monthly visitors before running reliable A/B tests.
Below this threshold, tests can take too long to run or fail to reach significance, meaning the results may not be trustworthy.
If your store is under the recommended traffic level, we typically shift to other data-driven optimisation methods, such as:
- User testing
- Heatmap and behavioural analysis
- Heuristic CRO reviews
- Iterative UX improvements without split testing
These approaches still uncover meaningful opportunities to improve conversion, even when full A/B testing isn’t feasible.
What metrics should I track during A/B testing?
Metrics depend on what the test is designed to improve. Common primary metrics include:
- eCommerce conversion rate
- Average order value (AOV)
- Revenue per visitor
- Subscription rate (if applicable)
- We also track supporting metrics like:
- Add to cart rate
- Bounce rate
- PDP visits
- Filter usag
- Interaction rates
This gives a full picture of why a variant won, not just whether it won.


