Titan Casket
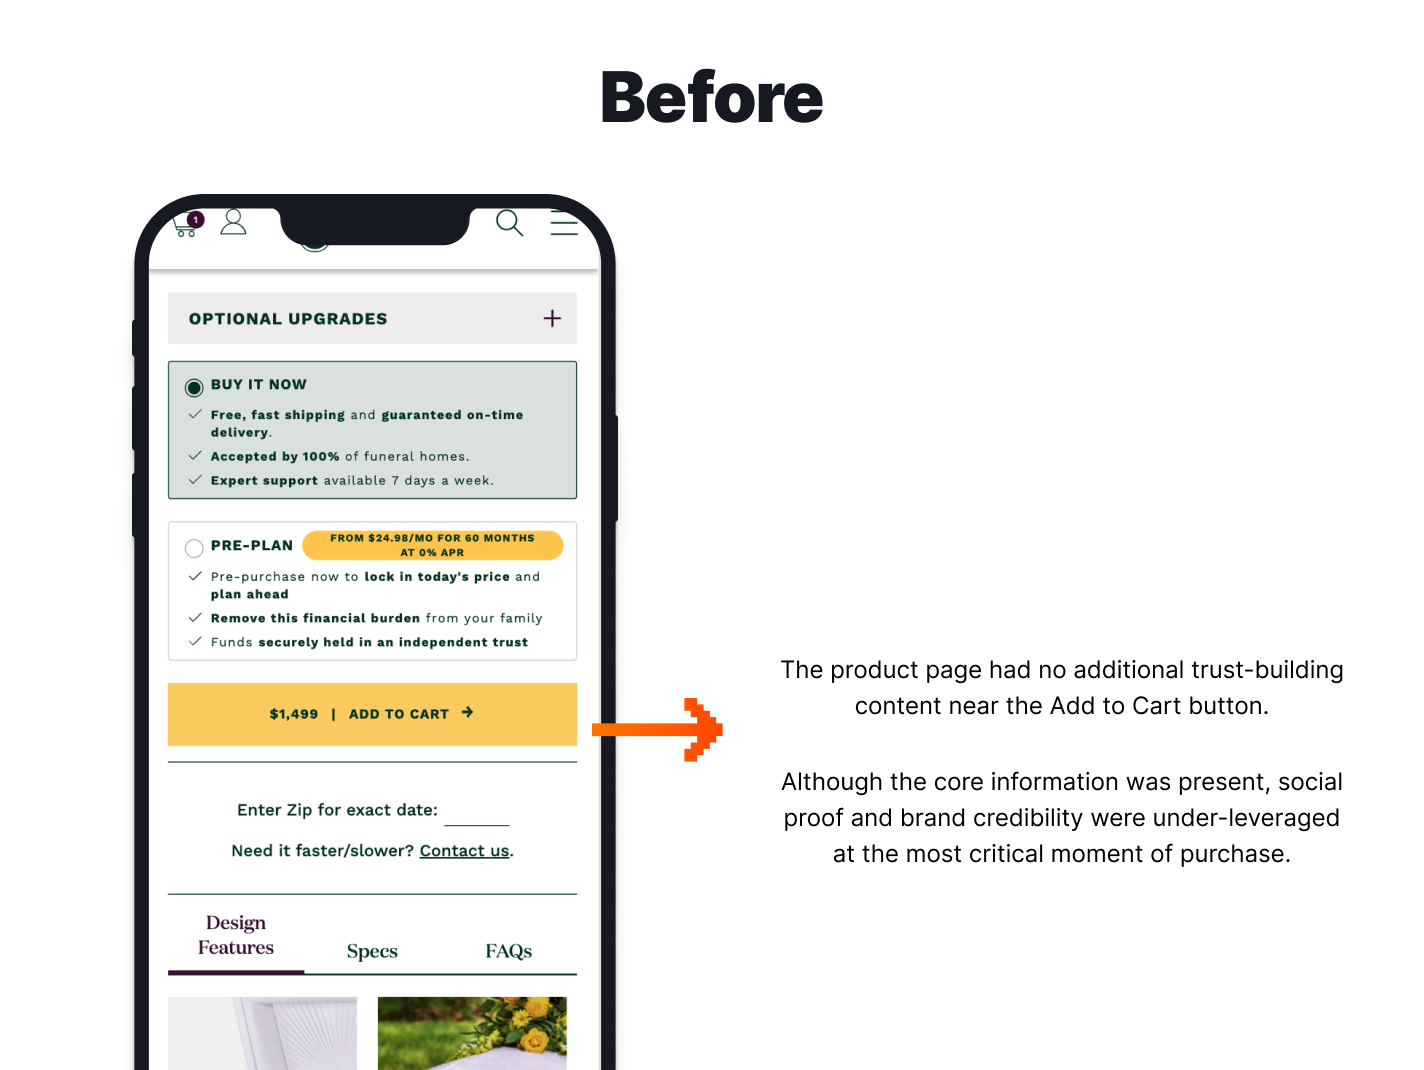
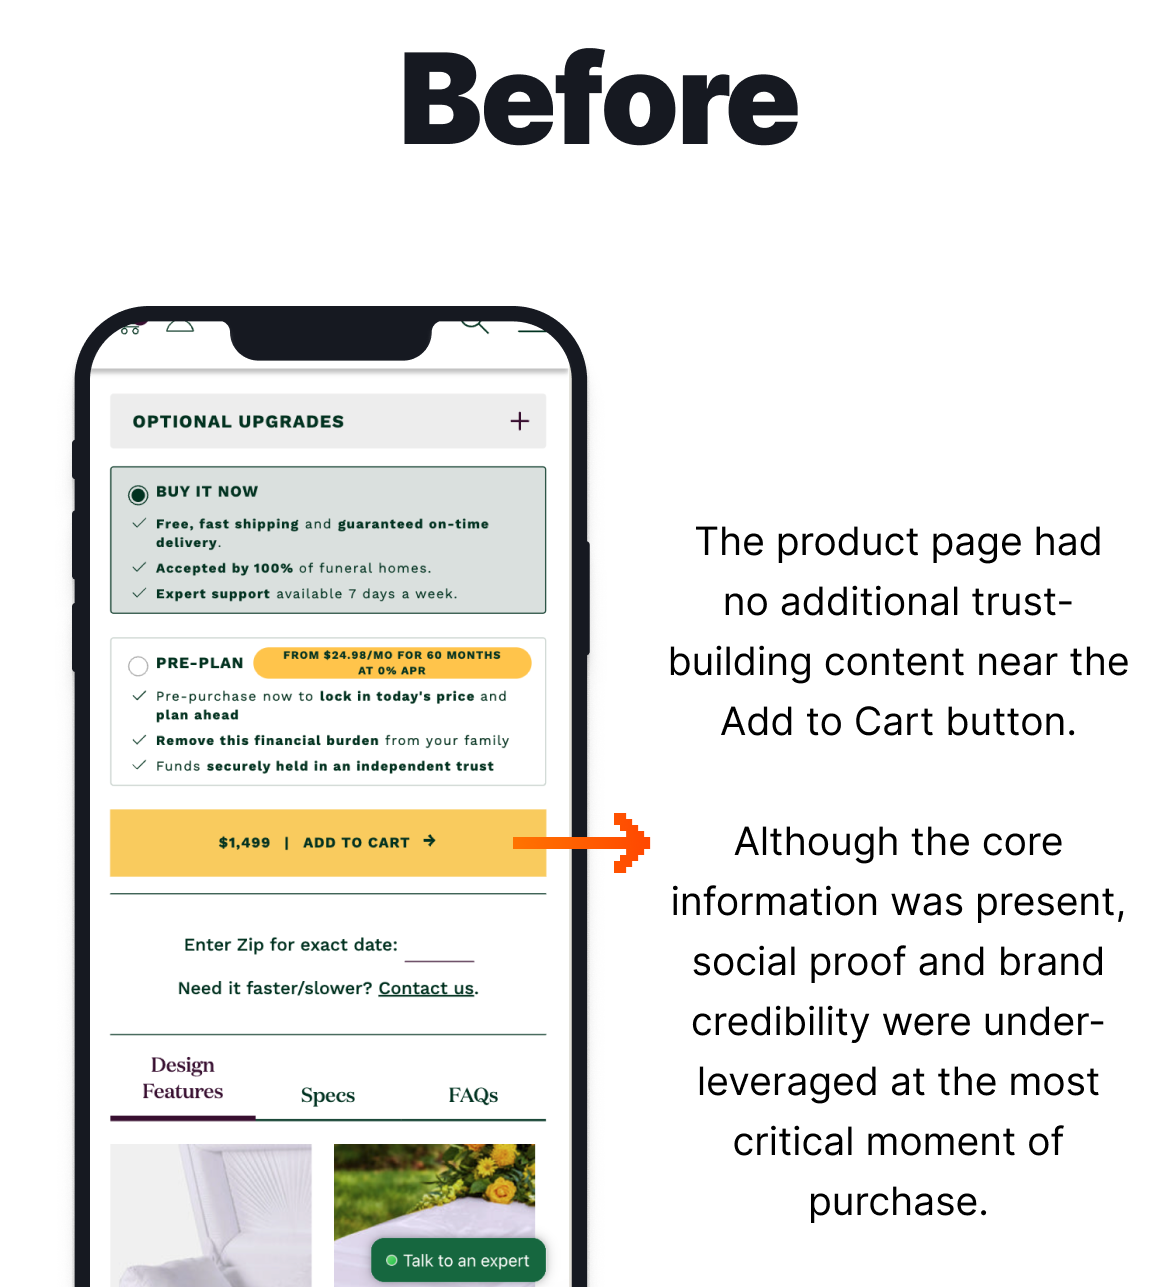
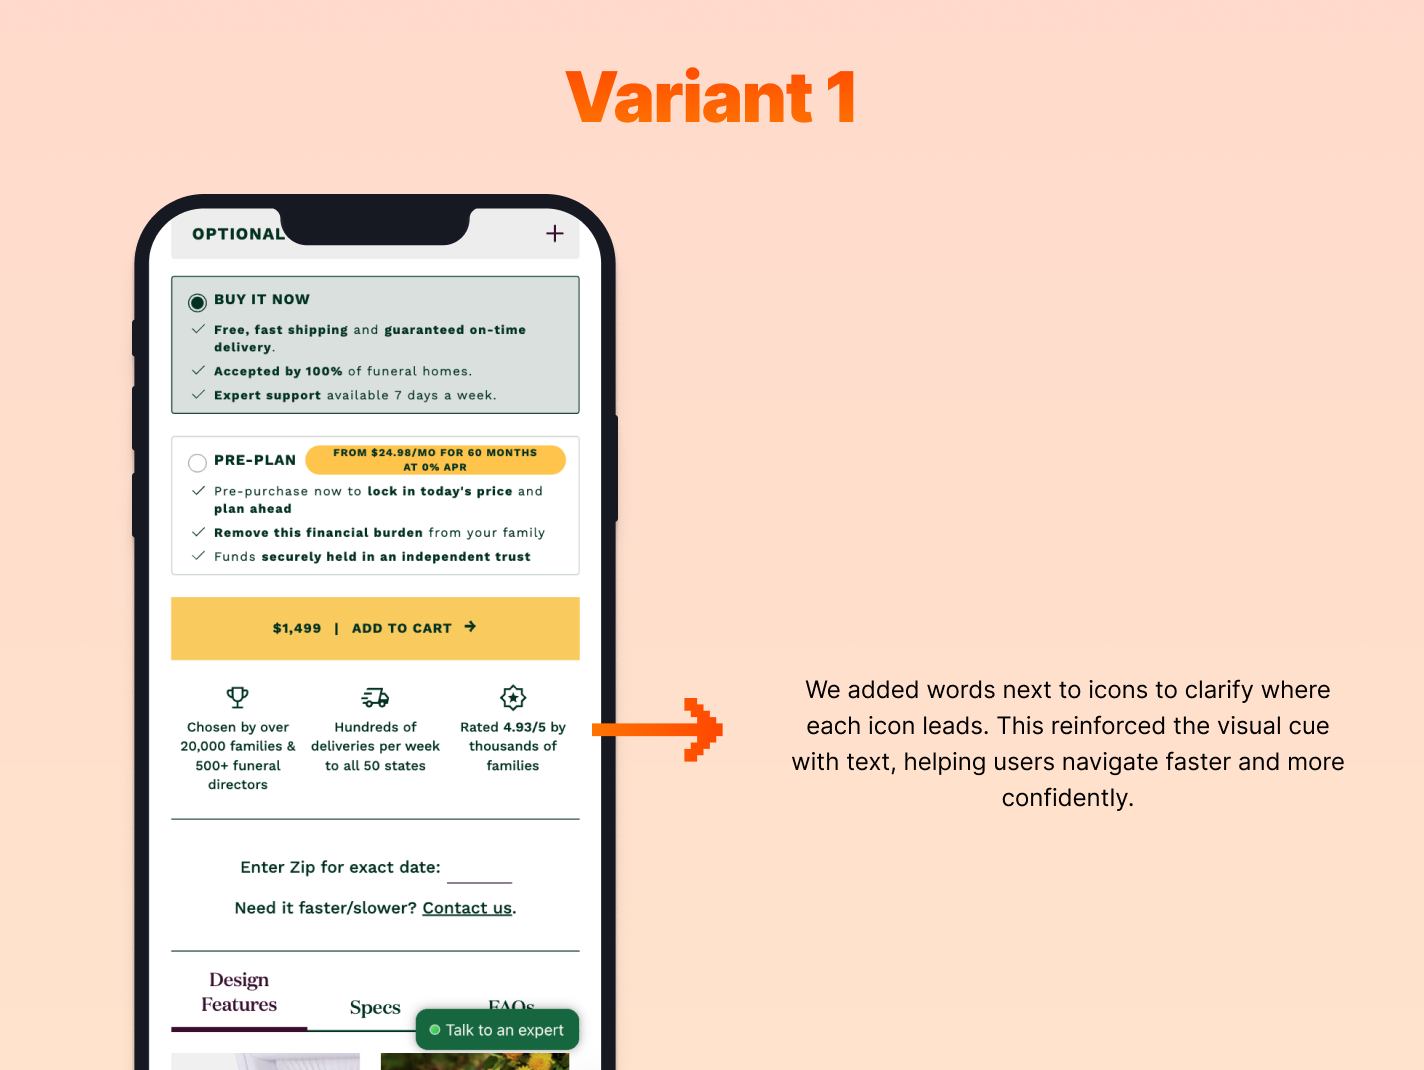
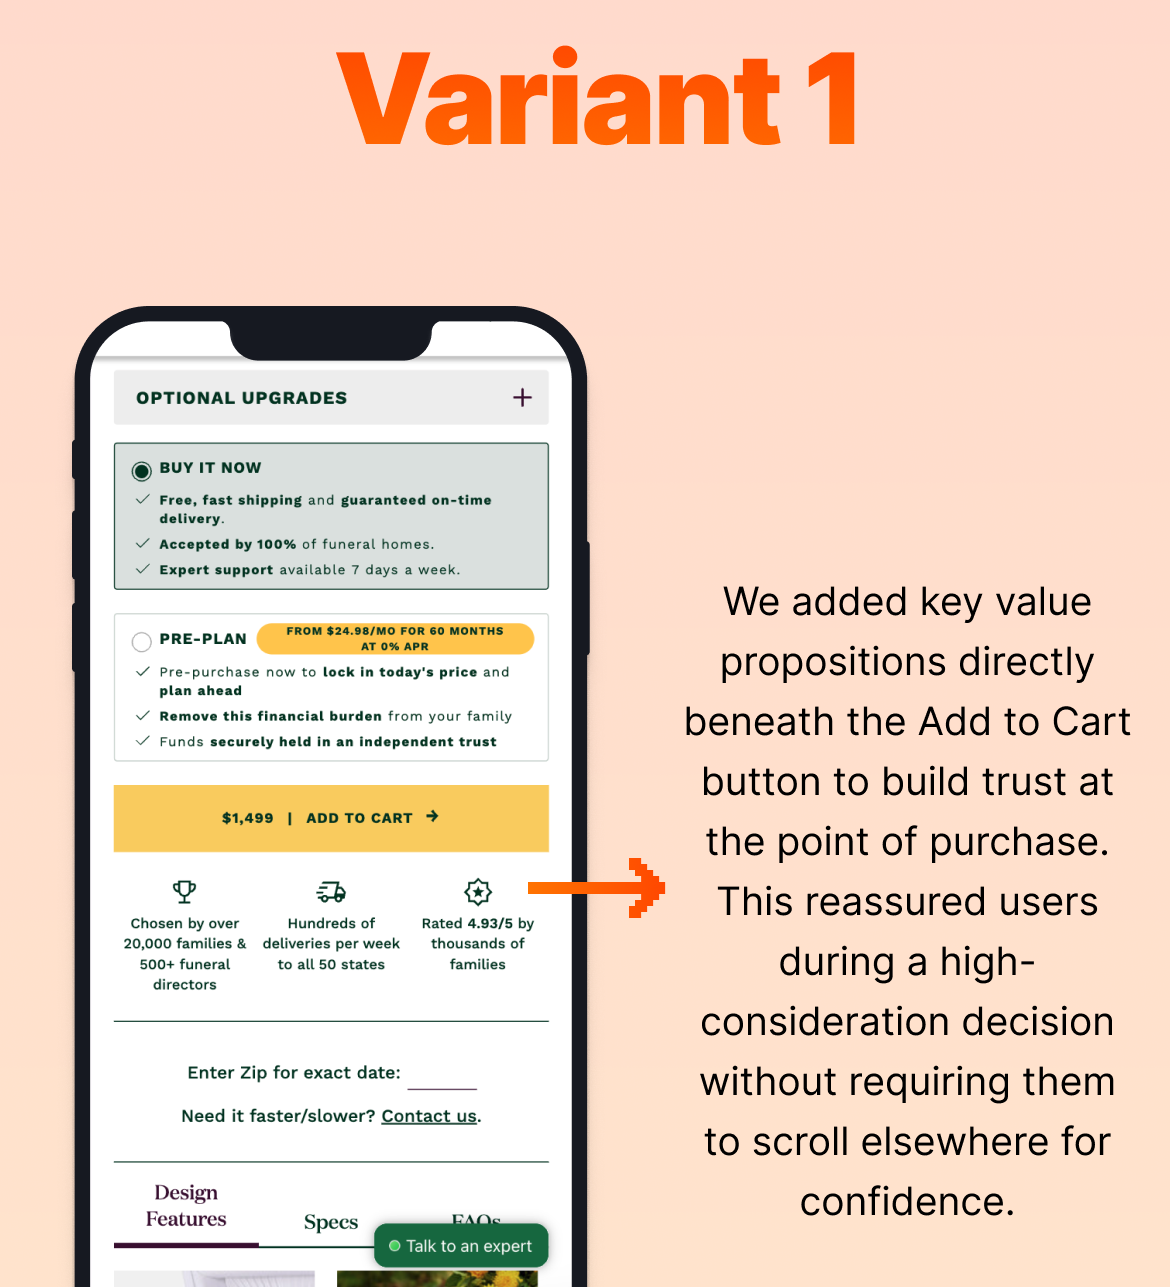
Adding Key Value Propositions Below the Add to Cart Button
A/B Test & Hypothesis
What the Data Told Us


Variant Structures
How the Test was Set Up


The Results
Over the two week testing period, Variant 1 consistently outperformed the original design across both desktop and mobile in key metrics such as Add to Cart Rate, Revenue per Visitor, and Conversion Rate. All devices saw increases with mobile devices seeing the most impressive increases including 47.7% increase in Add to Cart Rate, 32.7% increase in Conversion Rate, 105.2% increase in Revenue per Visitor, and 54.6% increase in Average Order Value. Similarly, desktop devices performed well with a 19.9% increase in Add to Cart Rate, 5.8% increase in Conversion Rate, 10.9% increase in Revenue per Visitor, and 4.8% increase in Average Order Value.
Based on the Overall results below, we implemented Variant 1 permanently.
-
34.5%
Increase in Add to Cart Rate -
13.5%
Increase in Conversion Rate -
39.8%
Increase in Revenue per Visitor

2025
WINNER
Standout CRO Agency of the Year

2025
WINNER
CRO Agency of the Year

2025
WINNER
Medium Agency of the Year

2025
WINNER
CRO Agency of the Year

2022
WINNER
CRO Agency of the Year

2022
WINNER
CRO Agency of the Year

2022
WINNER
Dev Agency of the Year
See More A/B Tests
-
 Search & Navigation
Redesign Mobile Menu
Could making the category menu more visual help users navigate faster, explore more products, and increase conversions and revenue?
-
 Search & Navigation
Utilising Story Widgets
Does redesigning category navigation with clearer, circular icons improve mobile conversions and subscription revenue?
-
 Collection Page (PLP)
Utilising Sub-Category Widgets
Will adding sub-category widgets on a collection page increase overall revenue?


