Jackson’s
66.18% Increase in Revenue per Visitor
A/B Test
Removing Express Checkout from the PDP
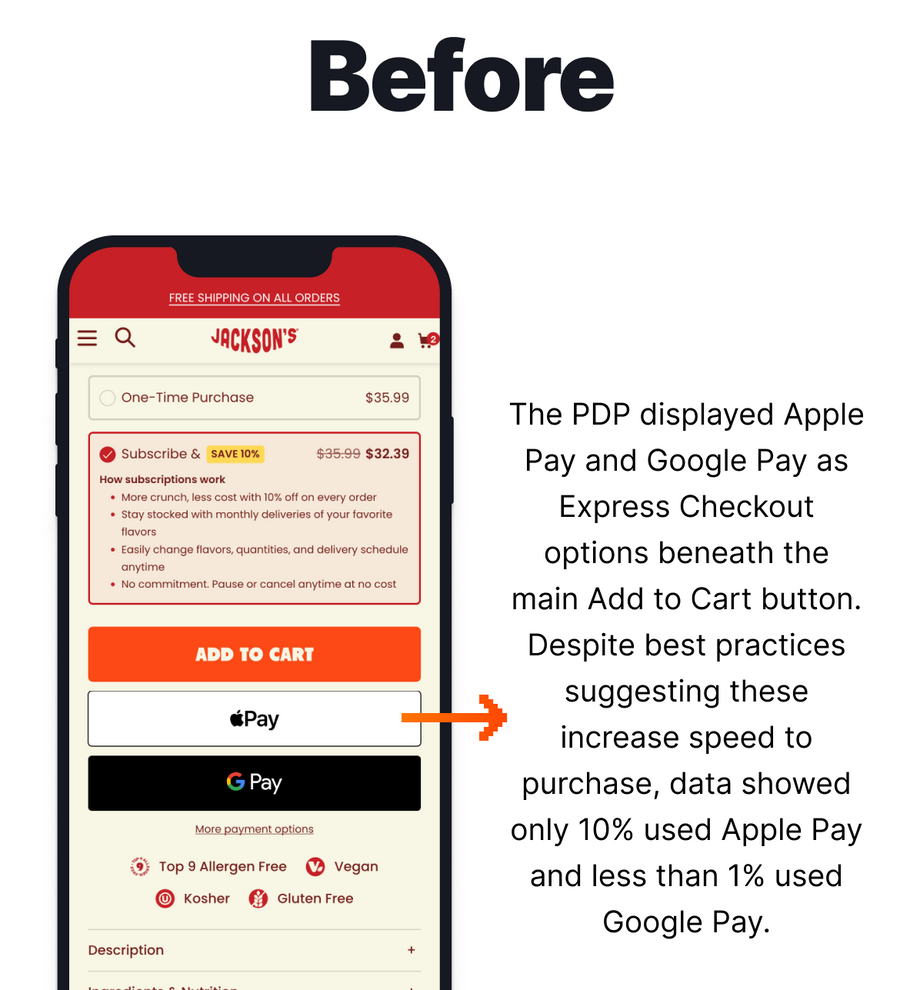
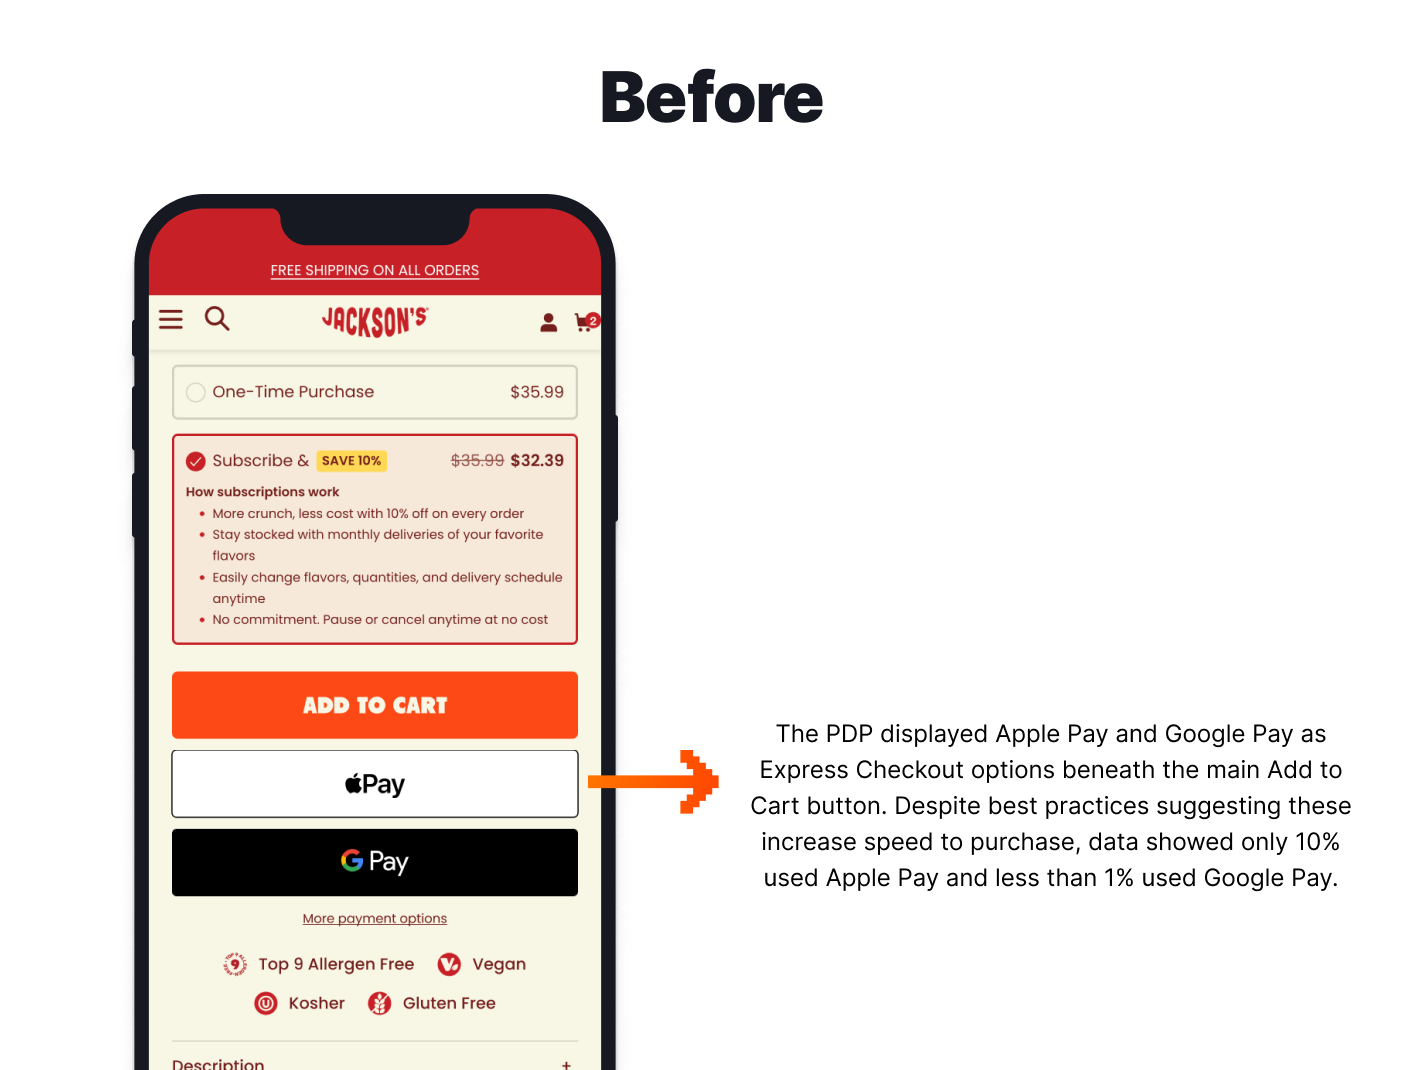
When conducting a test on the colour of the Add to Cart CTA, we wondered how many customers used the Express Checkout. We conducted tracking and analysis through Shopify Analytics and Google Analytics 4 to determine how many customers were using the Express Checkout and found that the numbers weren’t what we expected them to be with only 10% of users using Apple Pay and 0.9% of users using Google Pay.
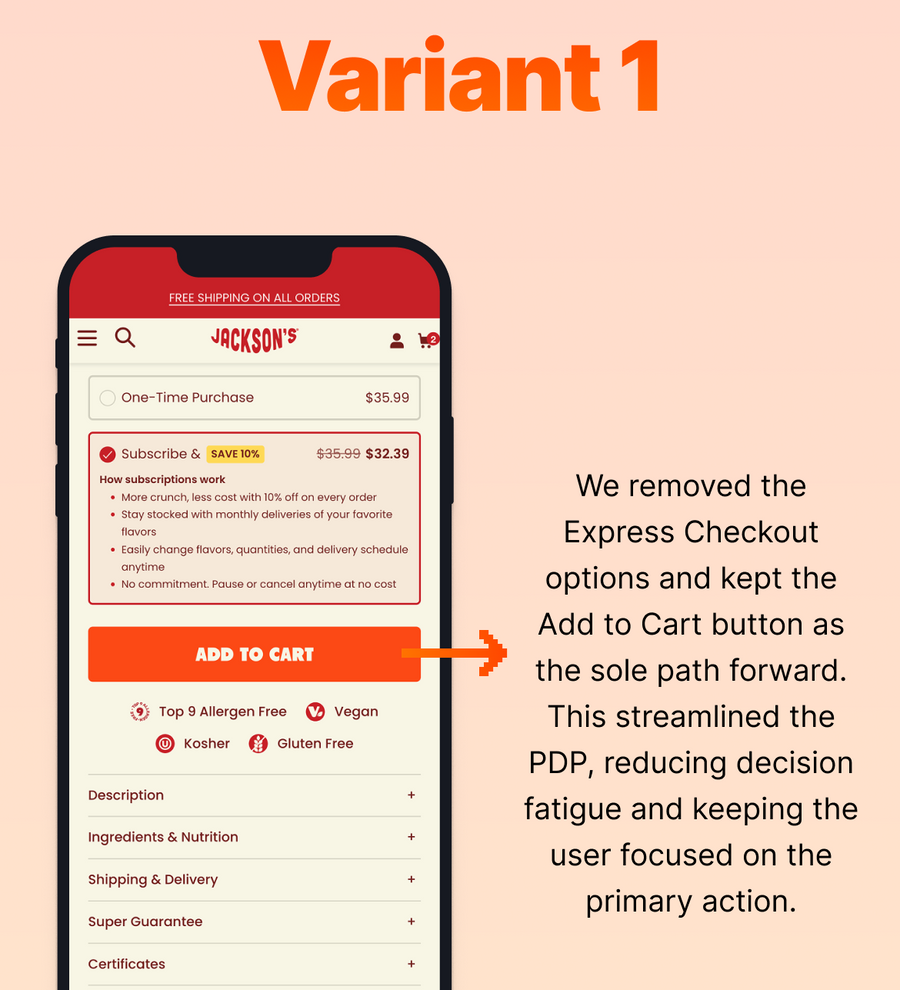
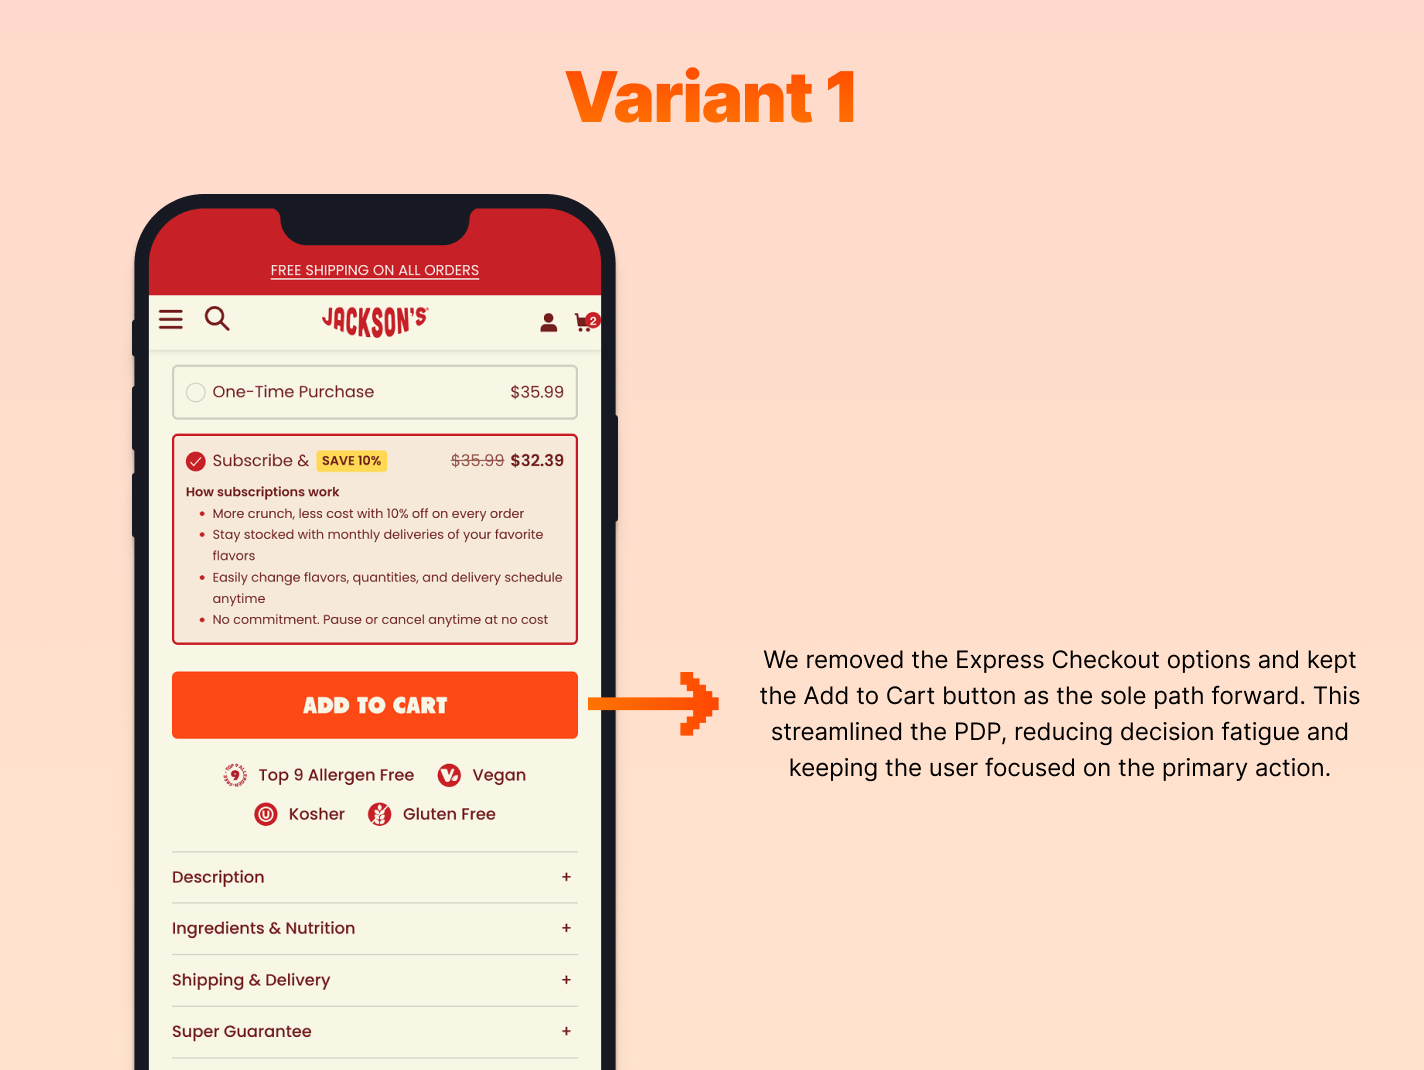
While we usually recommend testing the implementation of the Express Checkout for brands who don’t have this implemented, we wanted to test whether the Express Checkout for this client was hindering purchases instead of encouraging them. We conducted an A/B test with the Original displaying the Express Checkout below the Add to Cart button and the Variant displaying just the Add to Cart button.


The Results
After three weeks of analysis, we noted the large increase in Conversion Rate, clearly indicating a higher purchase rate. The increase of 66.18% in Revenue per Visitor brought a statistical significance of 93.82% which led us to conclude that Variant 1 was the ultimate winner. We set Variant 1, the version without the Express Checkout, live permanently. This test is an excellent example of not all recommendations working for all brands and the importance of A/B testing over direct implementation.
-
36.85%
Increase in Conversion Rate -
3.57%
Increase in Clicks on Add to Cart -
66.18%
Increase in Revenue per Visitor
More A/B Tests
-
 Search & Navigation
Redesign Mobile Menu
Could making the category menu more visual help users navigate faster, explore more products, and increase conversions and revenue?
-
 Search & Navigation
Utilising Story Widgets
Does redesigning category navigation with clearer, circular icons improve mobile conversions and subscription revenue?
-
 Collection Page (PLP)
Utilising Sub-Category Widgets
Will adding sub-category widgets on a collection page increase overall revenue?


