Hypothesis
How the Test was Set Up
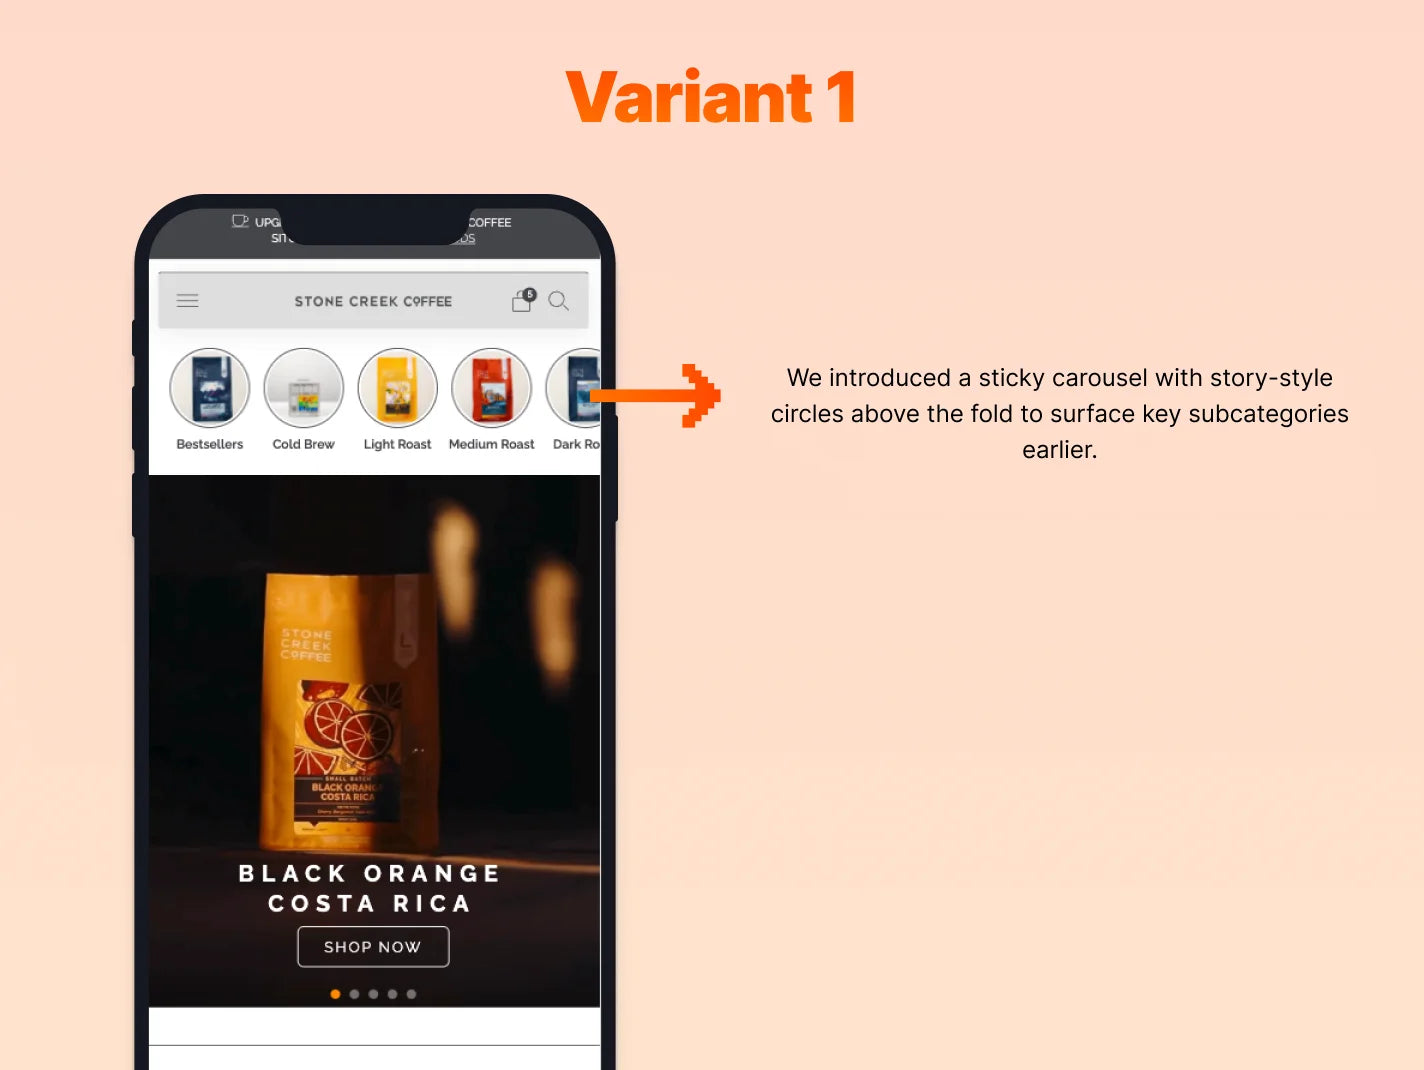
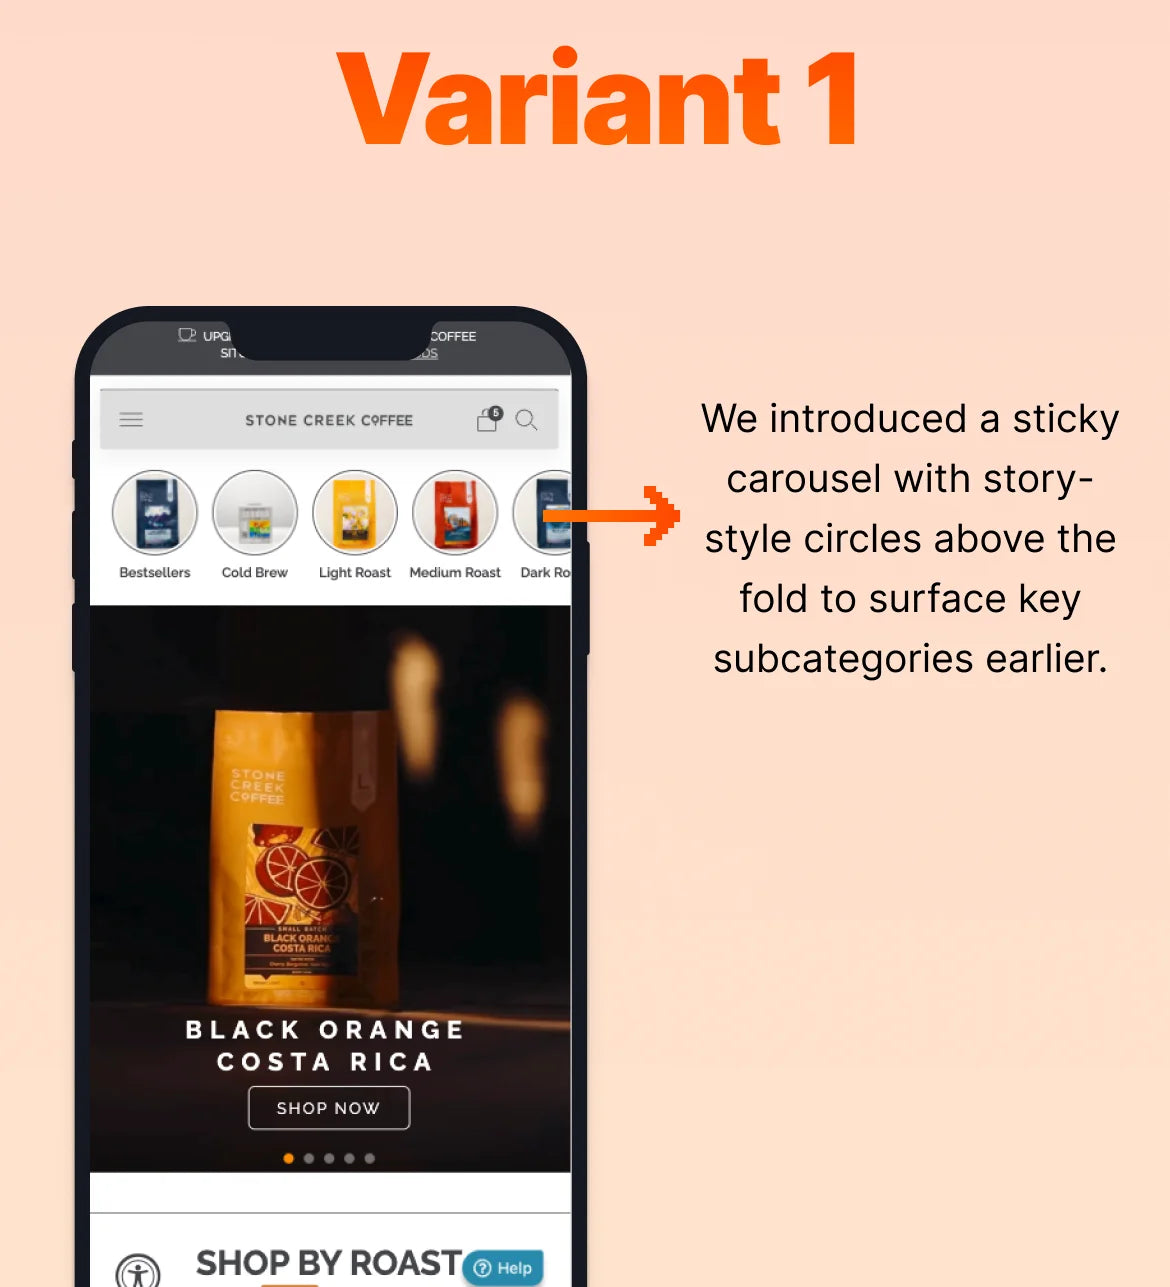
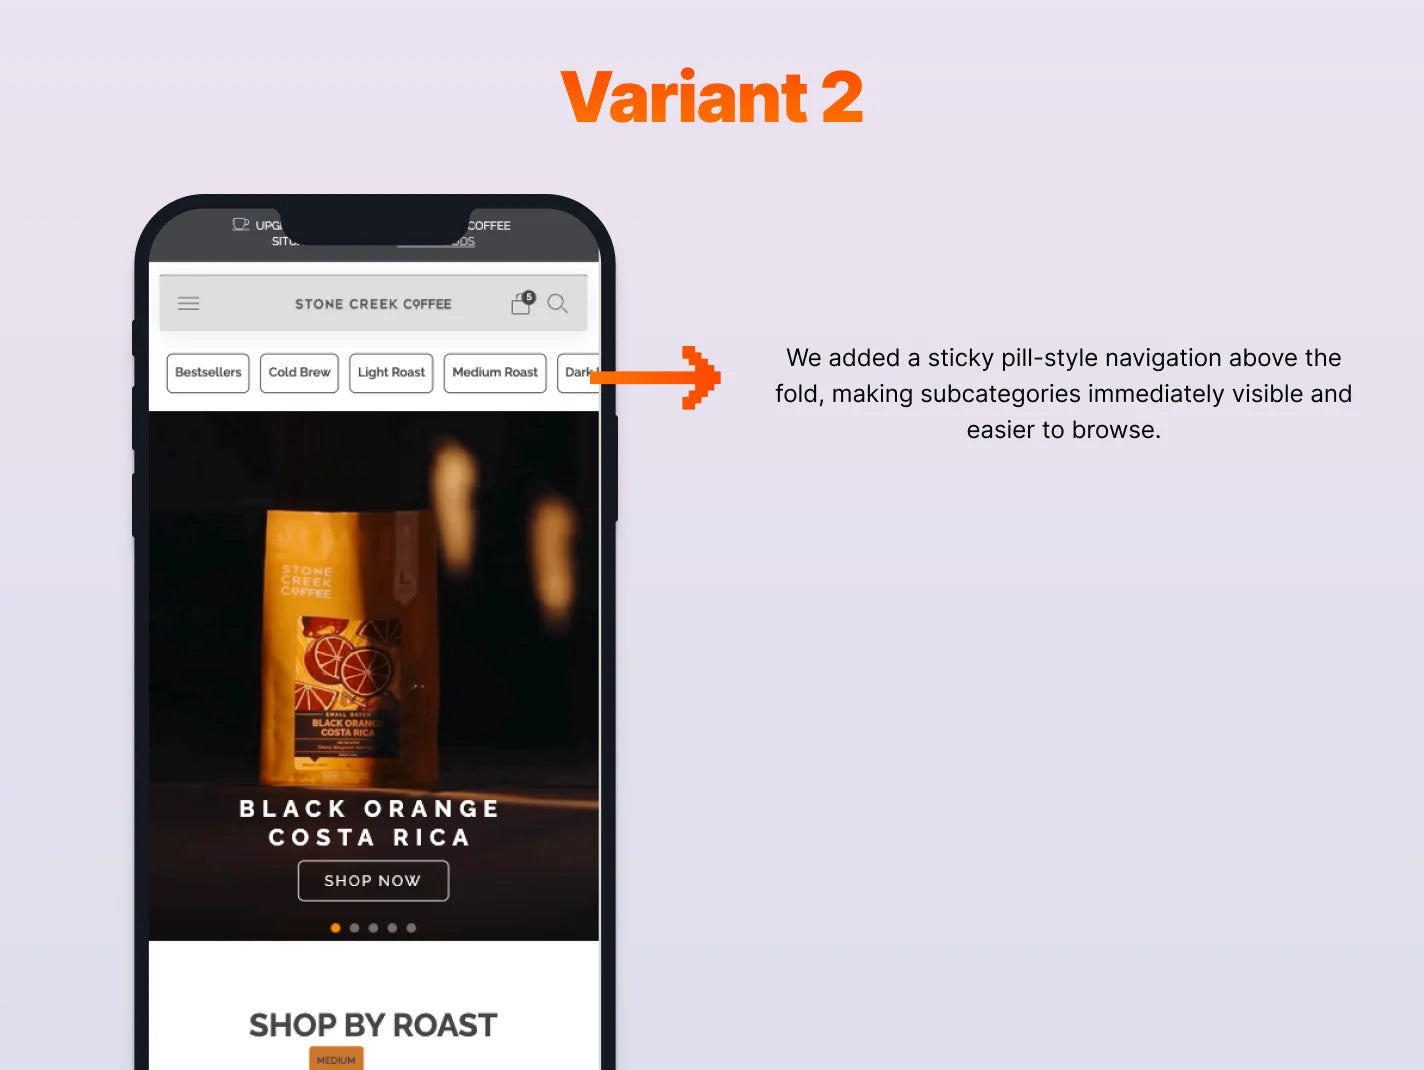
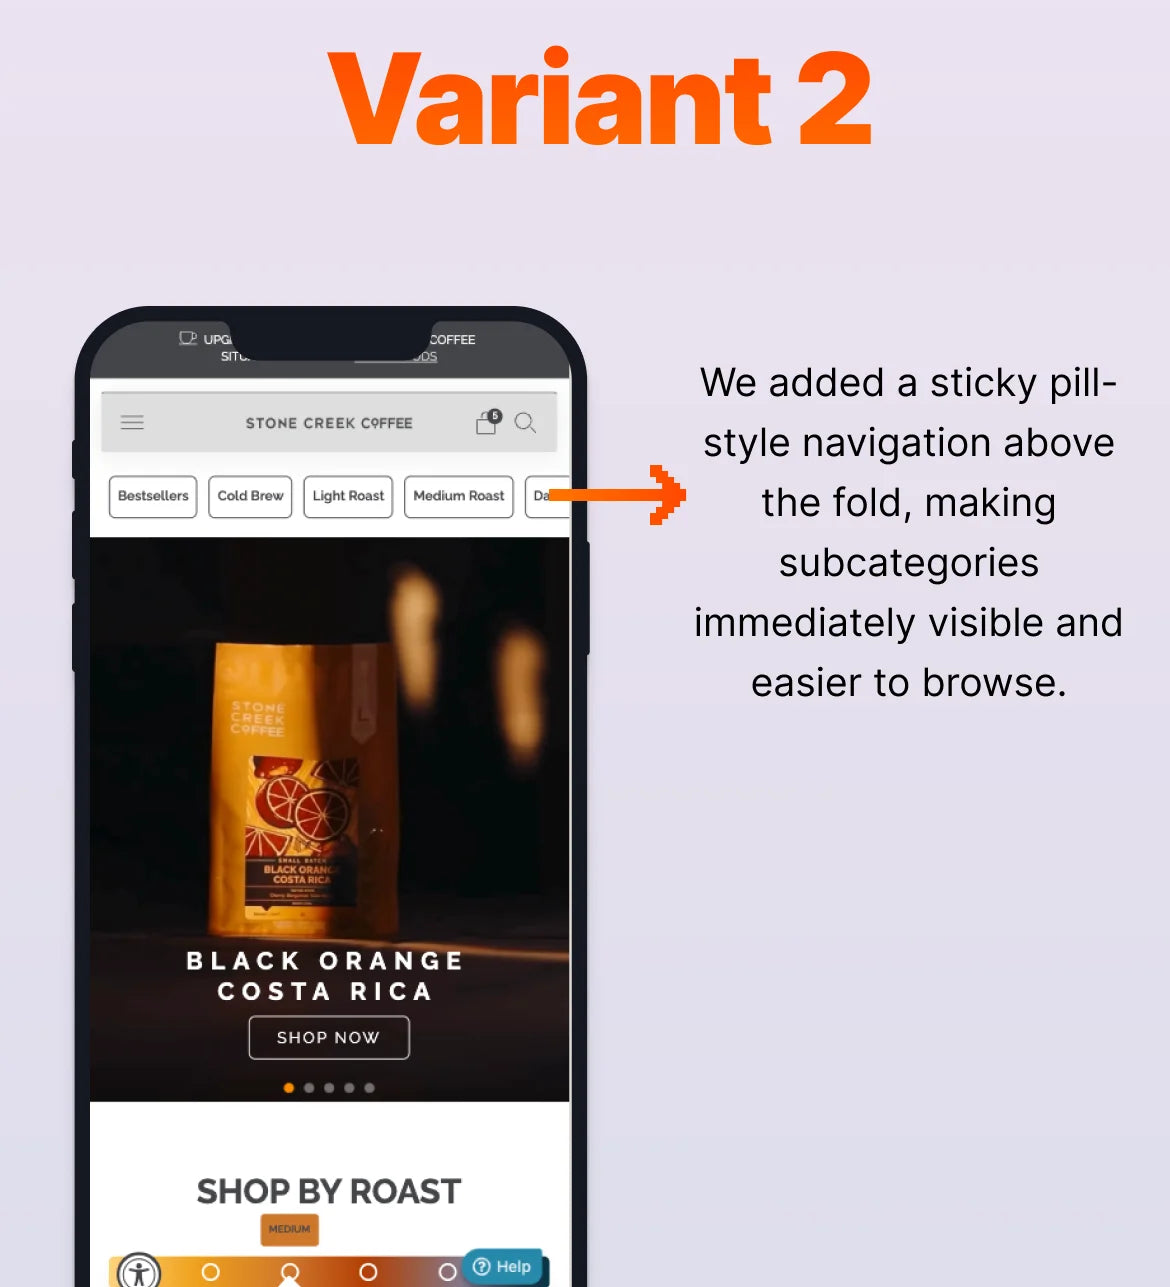
Variants
Why Stories vs Pills


-
 Product Page (PDP)
Improve Mobile PDP Conversion with Image Thumbnails
Making product visuals easier to preview helped mobile shoppers evaluate the product with more confidence and move further through checkout.
-
 Homepage
Increase Homepage Conversion with Full-Width Brand Imagery
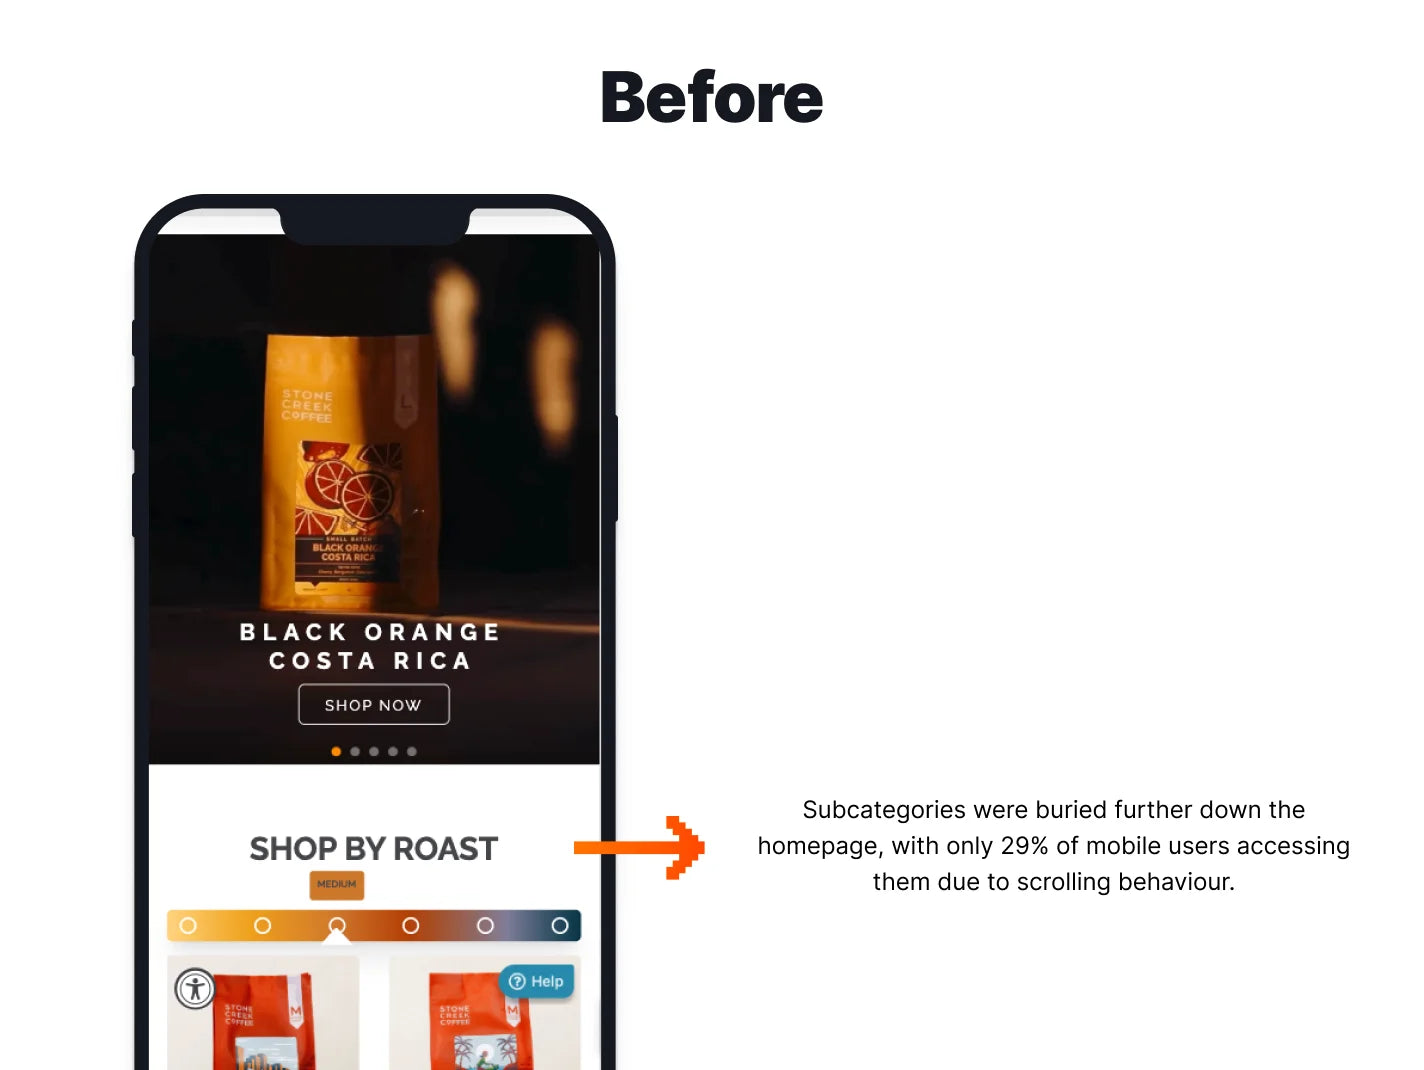
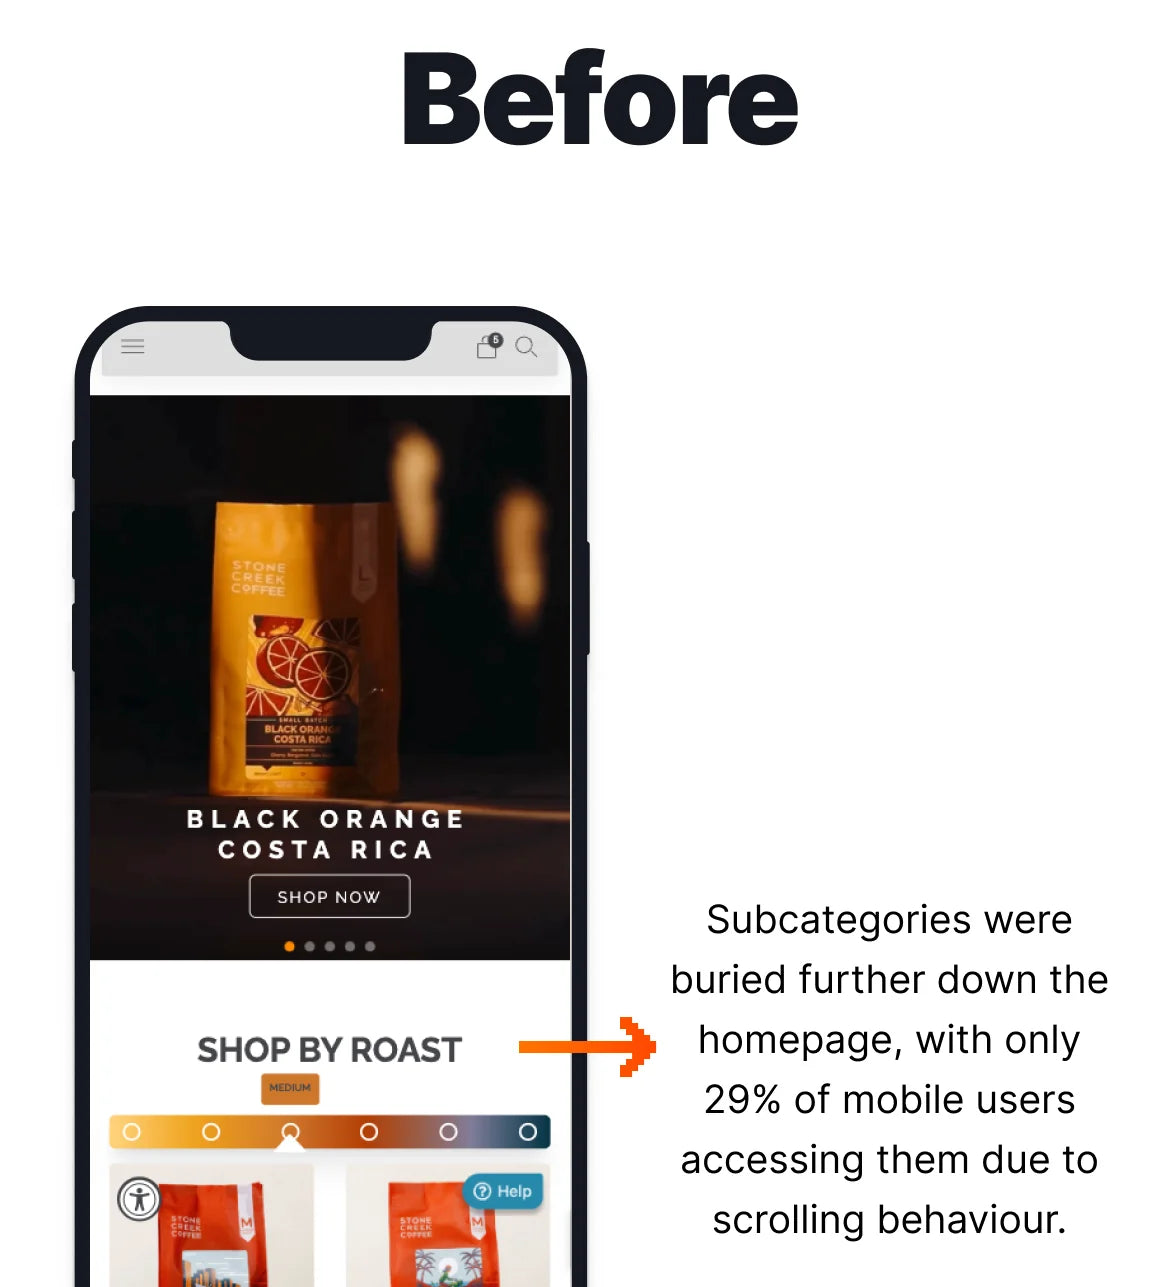
A fuller-width homepage layout helped Azuna create a clearer first impression, lifting conversion while exposing a subscription routing lesson.
-
 Product Page (PDP)
Adding a Back Link to PDPs Improves Mobile Revenue per Visitor
A simple “Back to Results” link helped mobile shoppers return to browsing more easily and delivered a projected monthly revenue lift.


