Hypothesis
How the Test was Set Up


-
 Search & Navigation
Improve Mobile Product Discovery with Visual Category Tiles
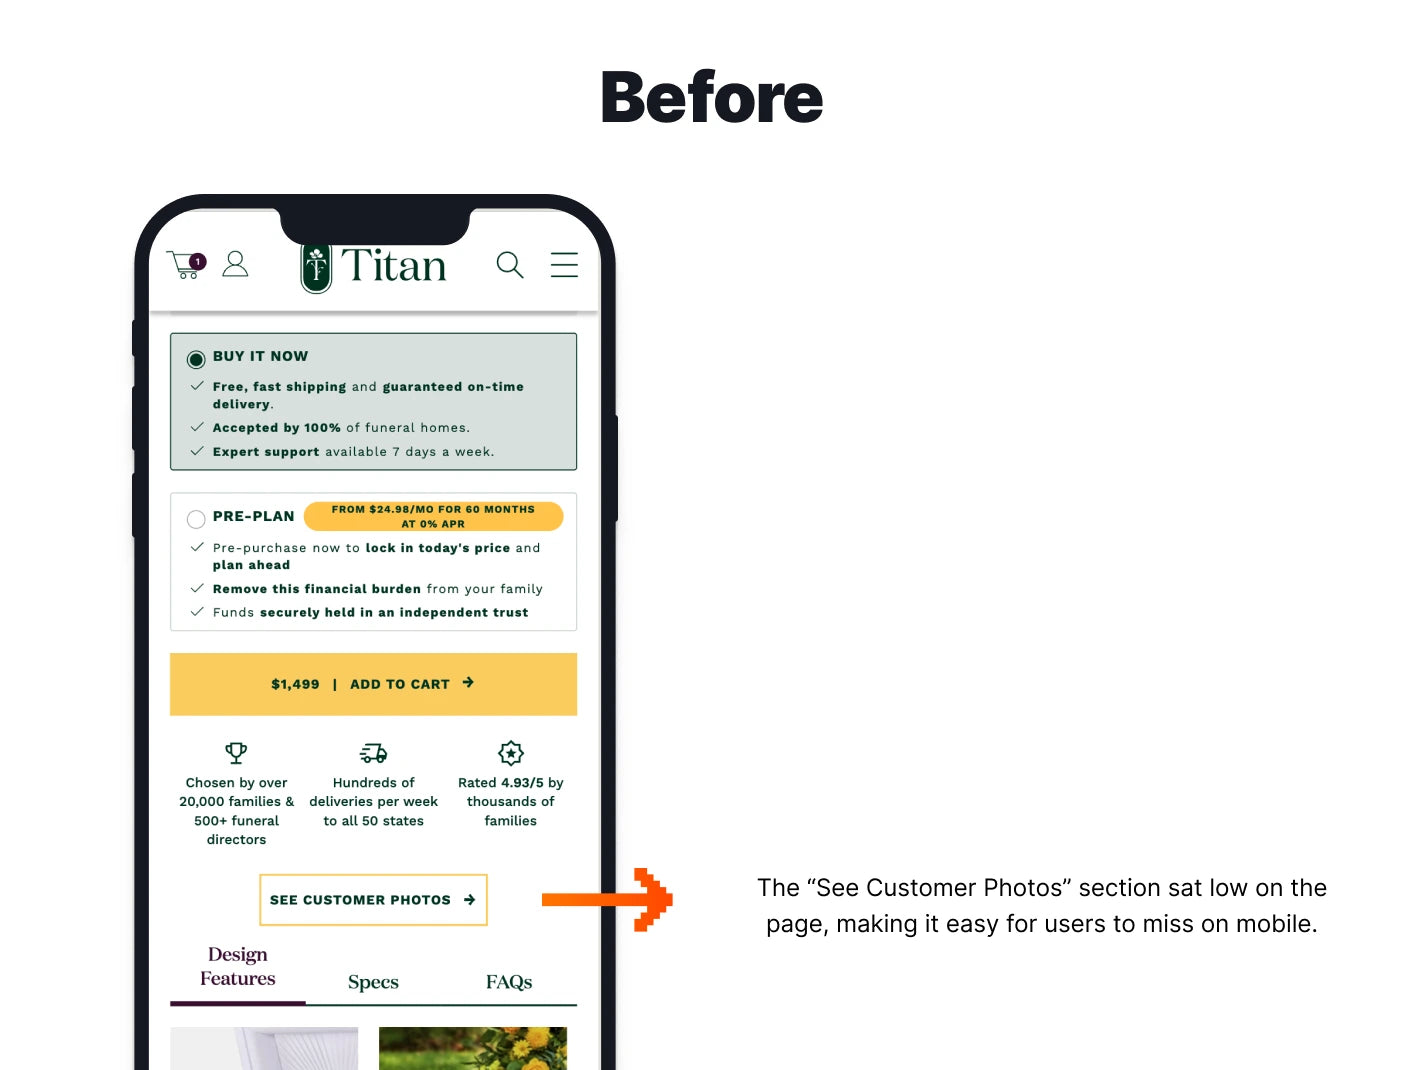
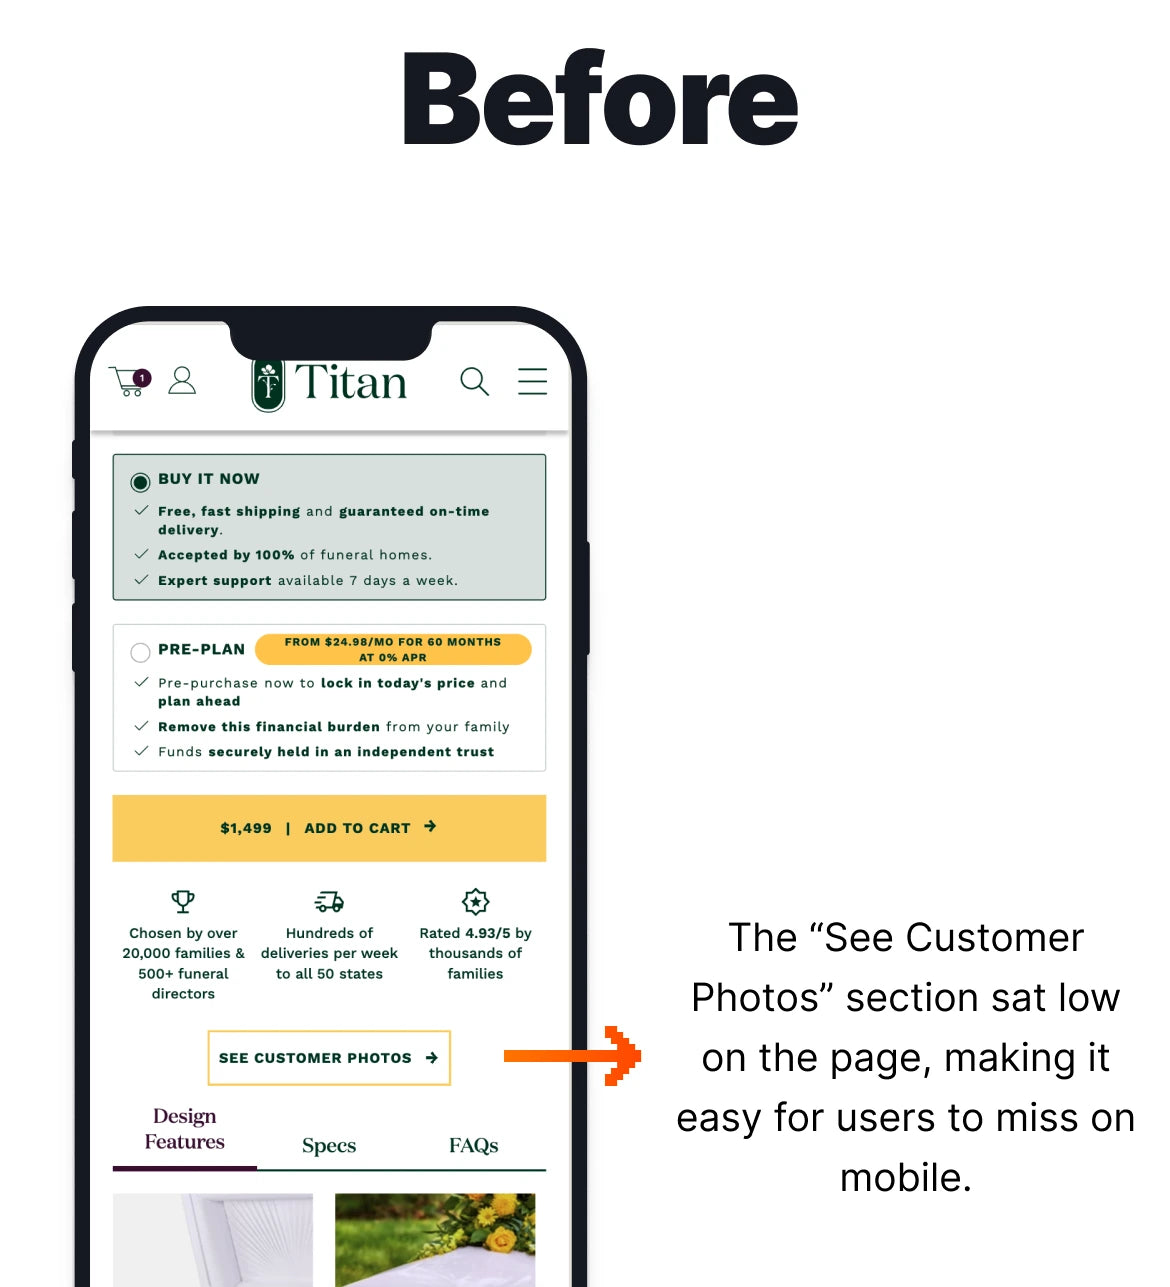
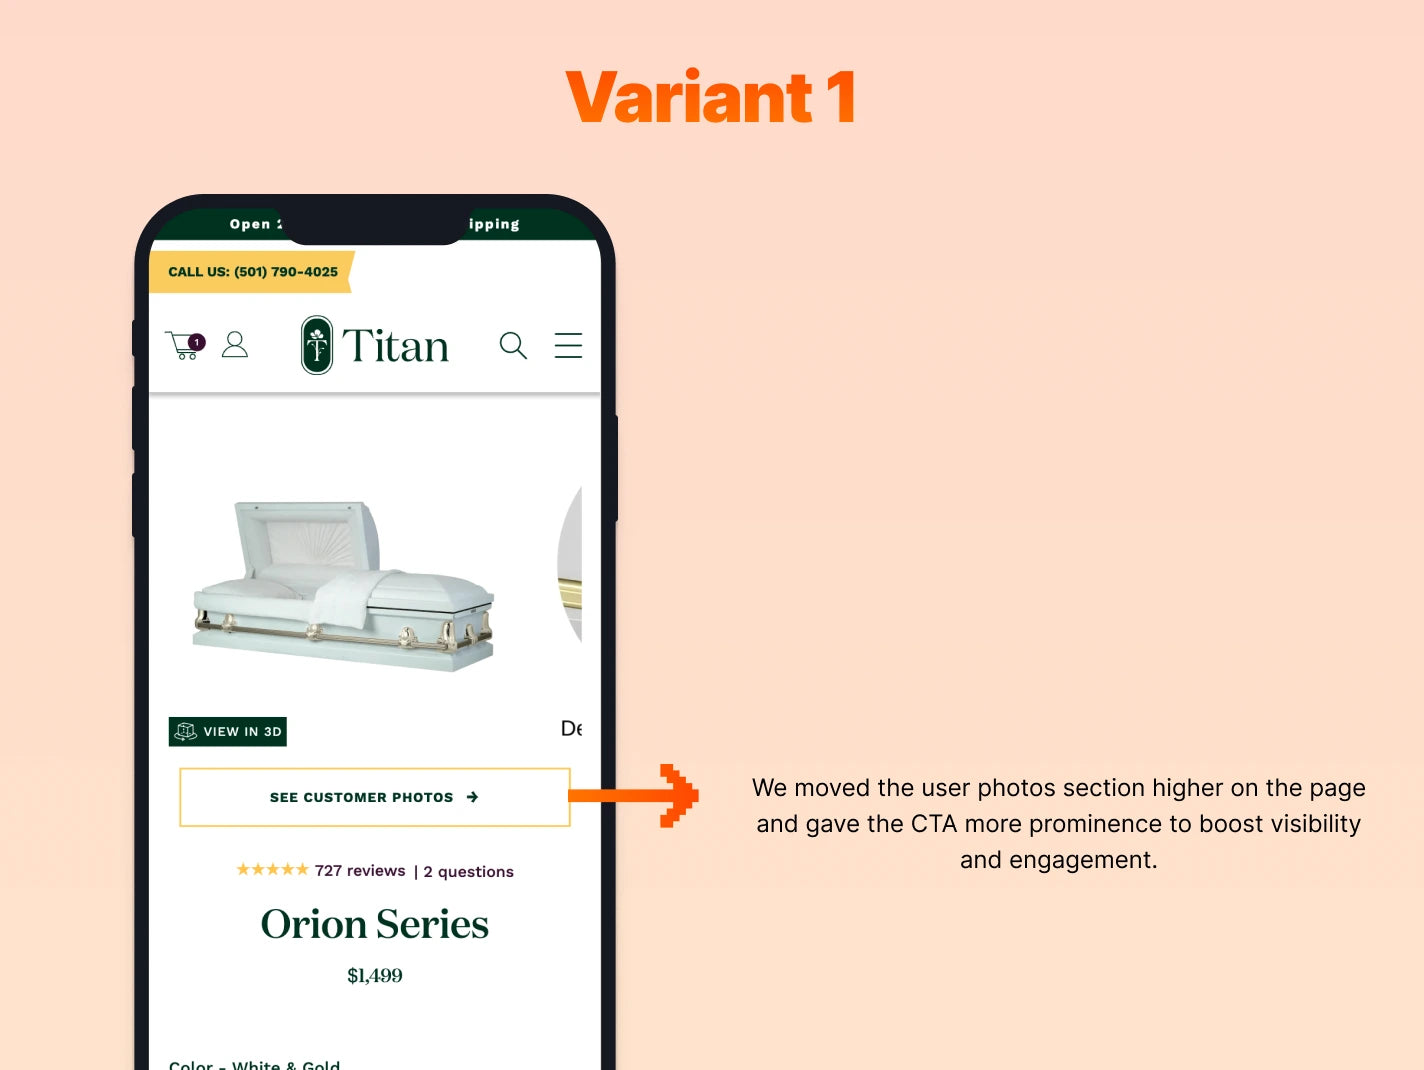
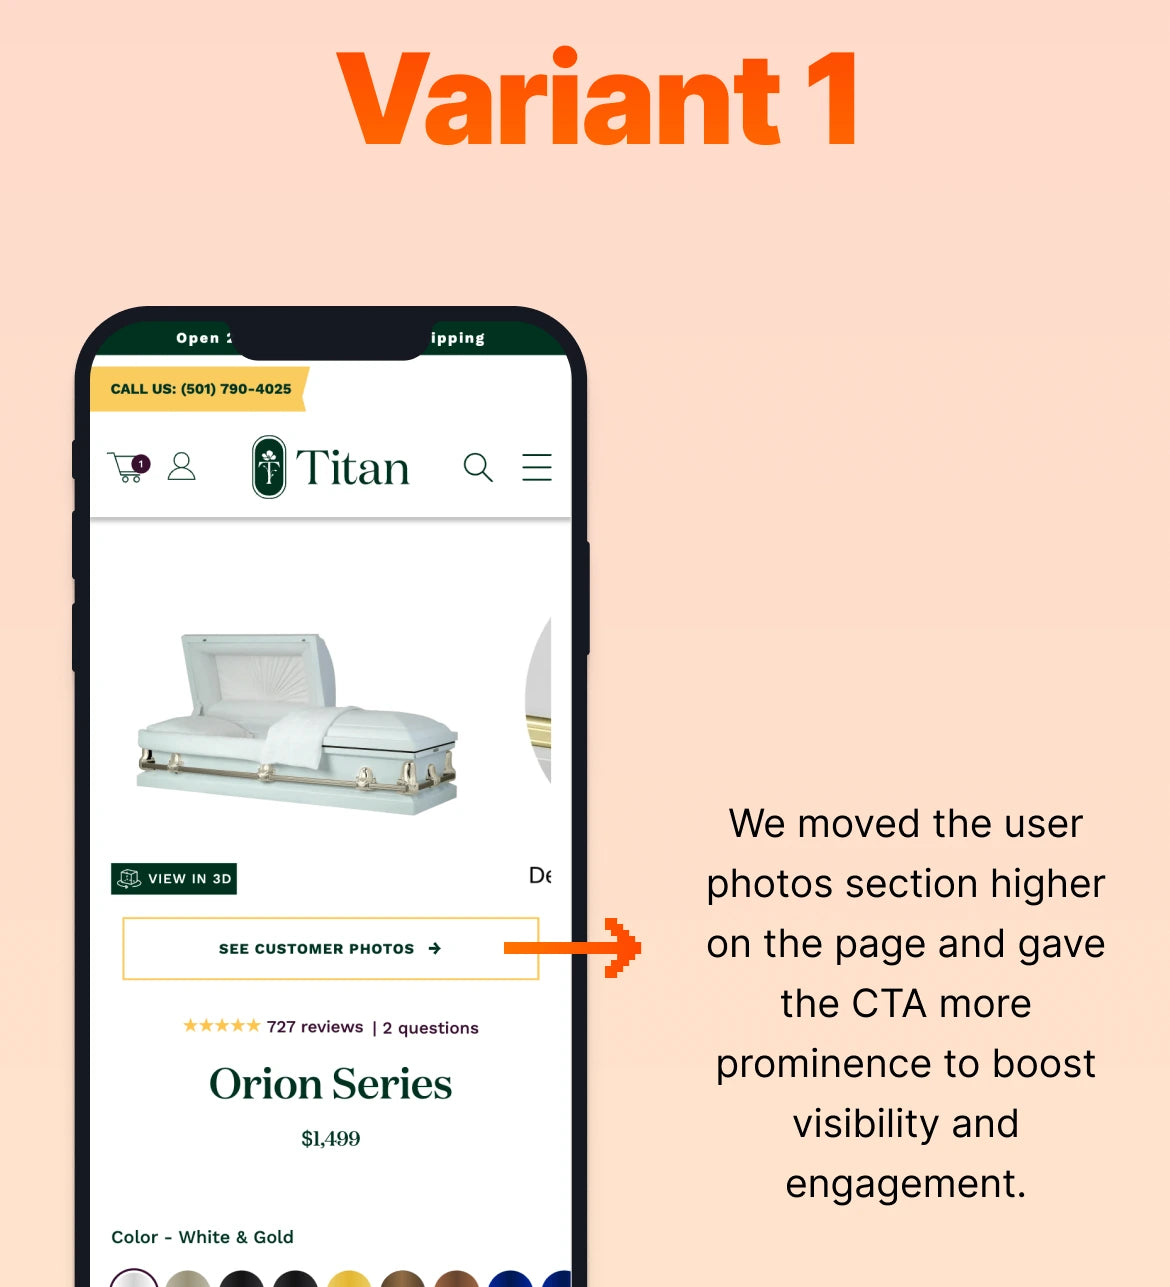
Image-led mobile category tiles helped shoppers find relevant products faster and move further through the purchase journey.
-
 Homepage
Increase Revenue per Visitor with Hero CTAs
Adding a fuel-pump finder CTA to the homepage hero helped auto brand Aeromotive send motivated shoppers toward higher-value products.
-
 Product Page (PDP)
Improve Mobile PDP Revenue with Visible Payment Options
Testing checkout shortcuts against visible payment options revealed a mobile-only opportunity that would have been hidden in the overall result.


