A/B/C Test

What the Data Told Us

This client has worked with us for a few years, and after the BFCM season of 2024, we decided to analyse the performance the season and the site to analyse what could be improved for future seasons. When conducting this analysis, we were concerned that Reached Checkout Rates decreased over BFCM compared to October. While other metrics increased, we wanted to ensure that customers had all the information they needed on the product detail page, to guide them to the checkout page and complete their purchase. One of the main conversion-critical questions that customers ask are about the product itself, and for this brand specifically, how it will benefit them, and about the trustworthiness of the brand itself.
Jump to results

Hypothesis

What We Wanted to Achieve
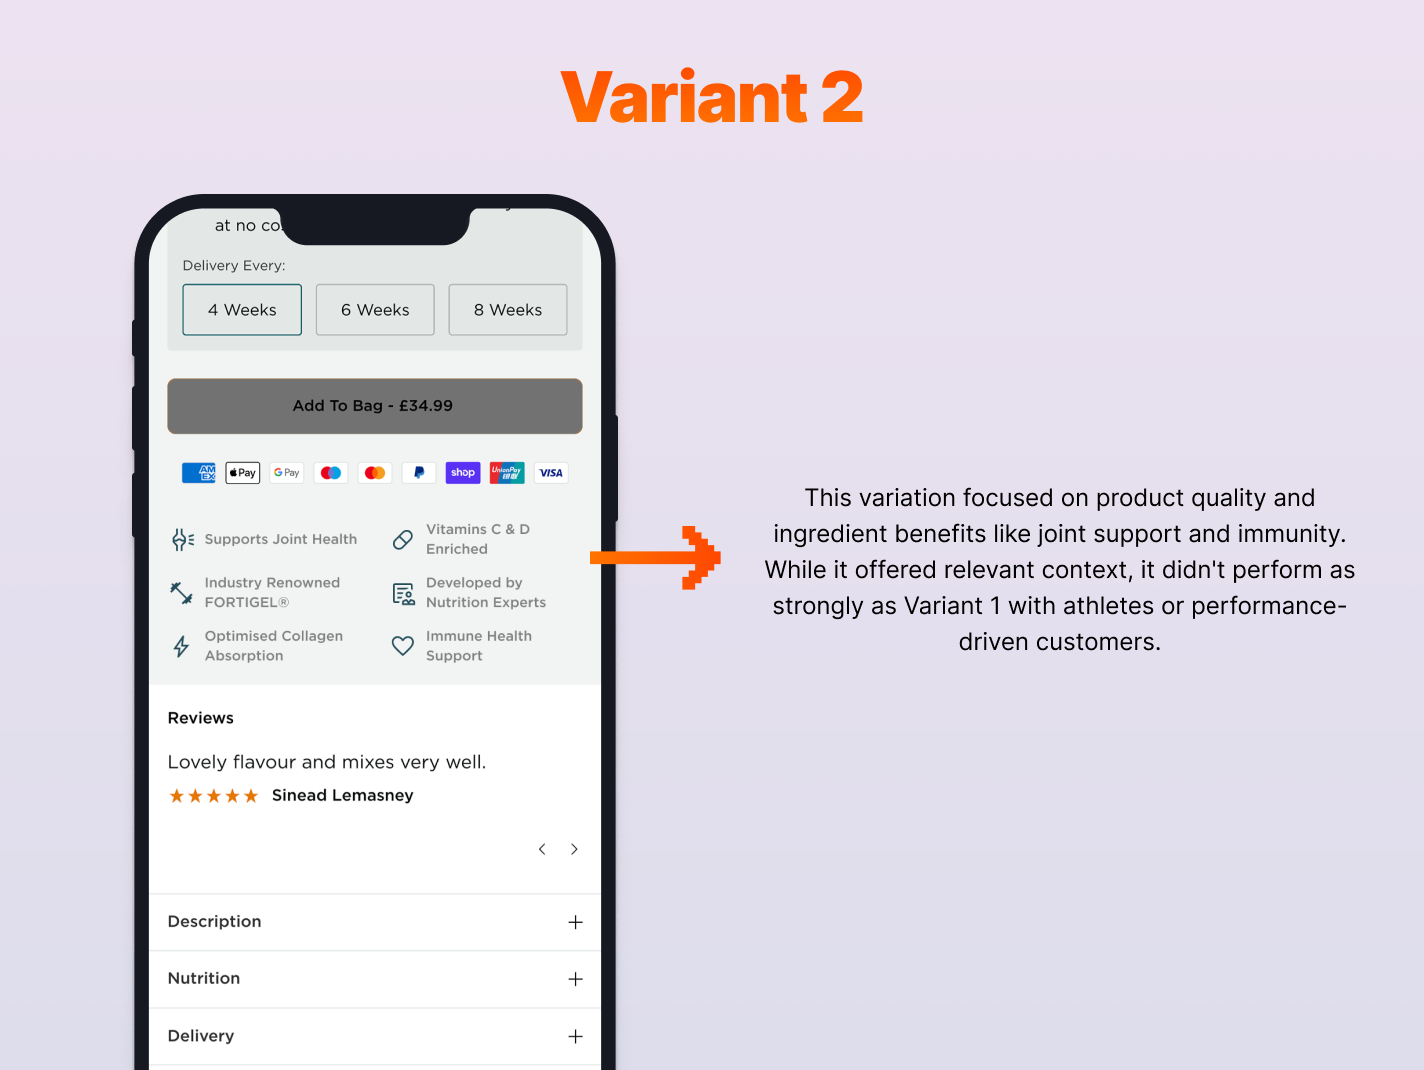
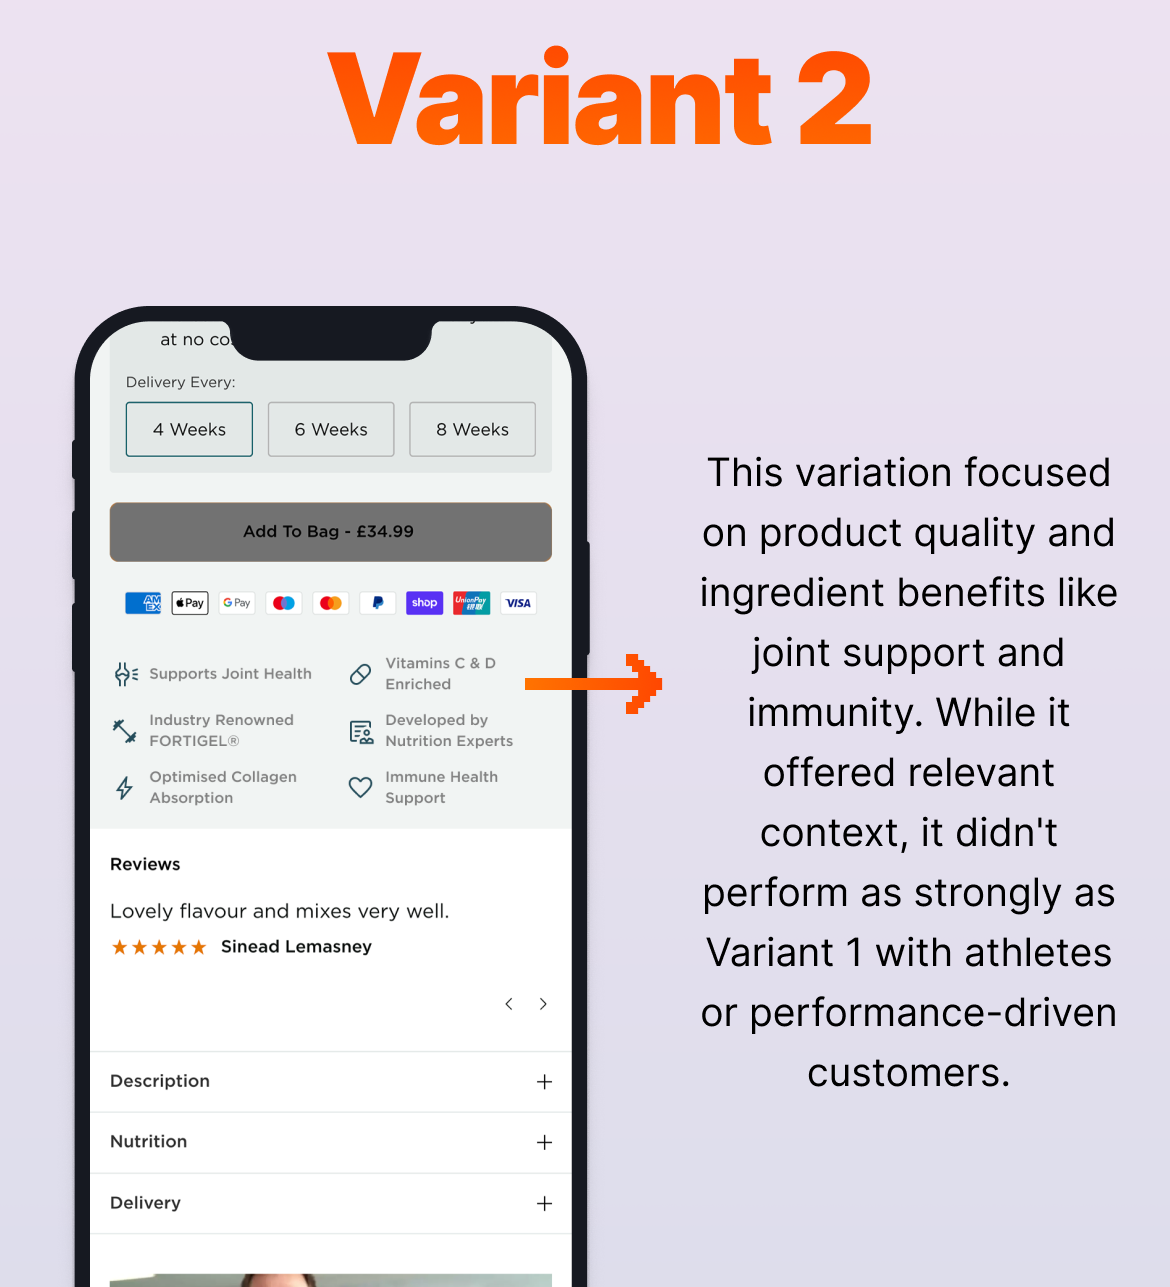
We hypothesised that by placing key value propositions consistently across all product detail pages below the “Add to Cart” button, this would answer any questions customers might have. However, we were undecided as to whether or not these should be product-based (such as the benefits of the product, how it would increase workout performance, etc) or brand-based (such as product testing, quality assurance, etc).

Variants

How the Test was Set Up
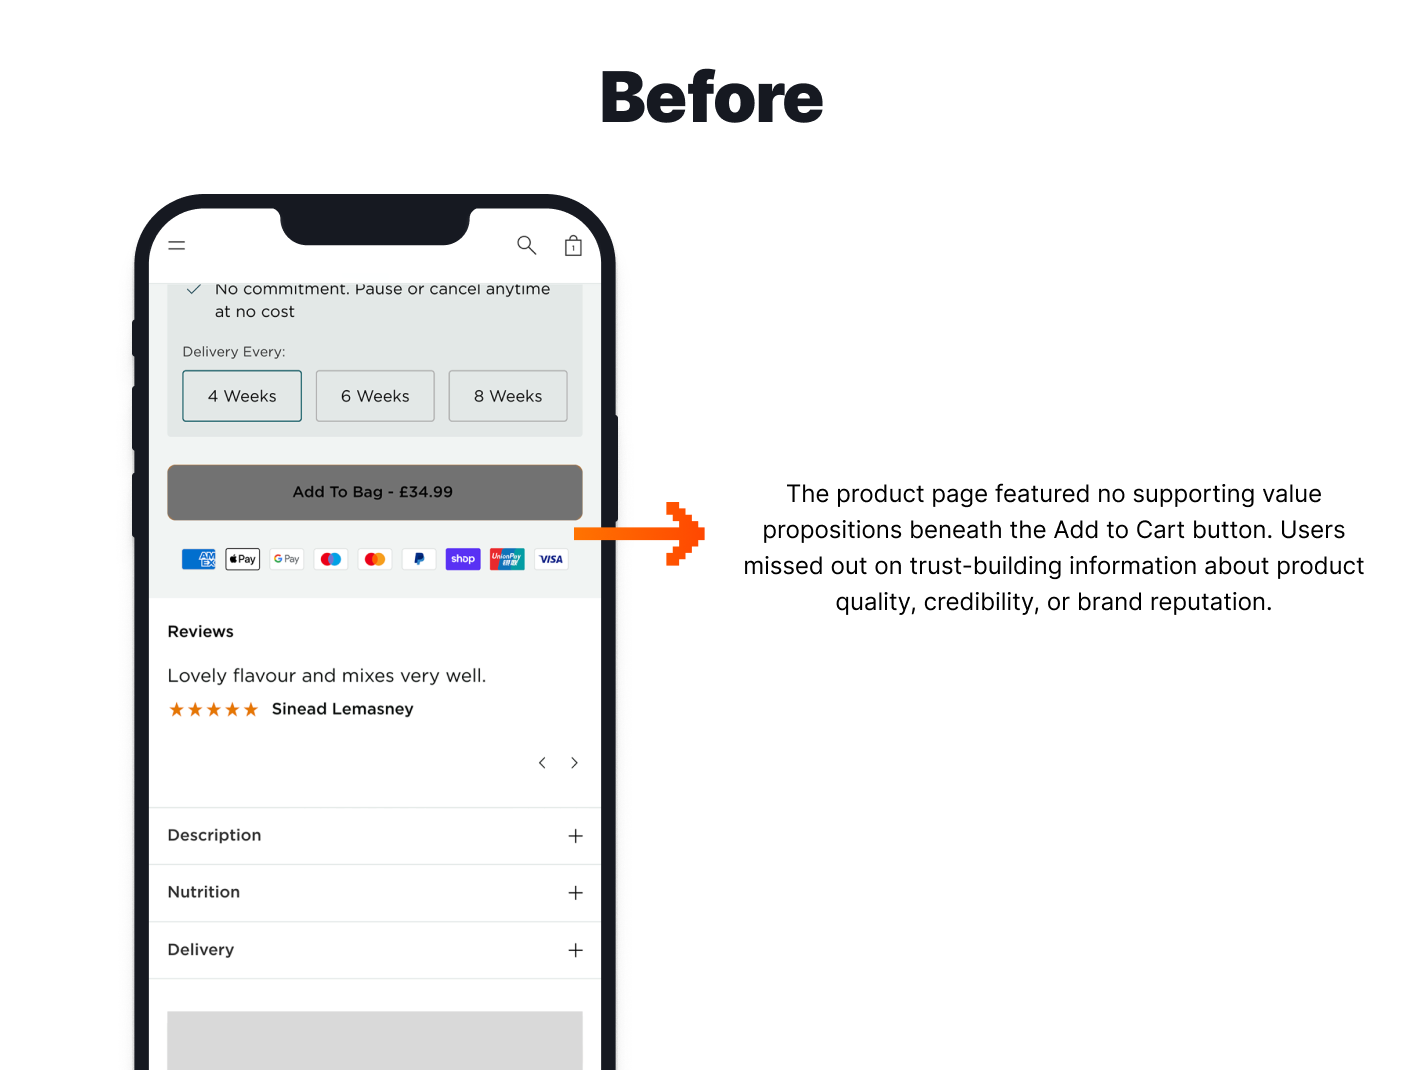
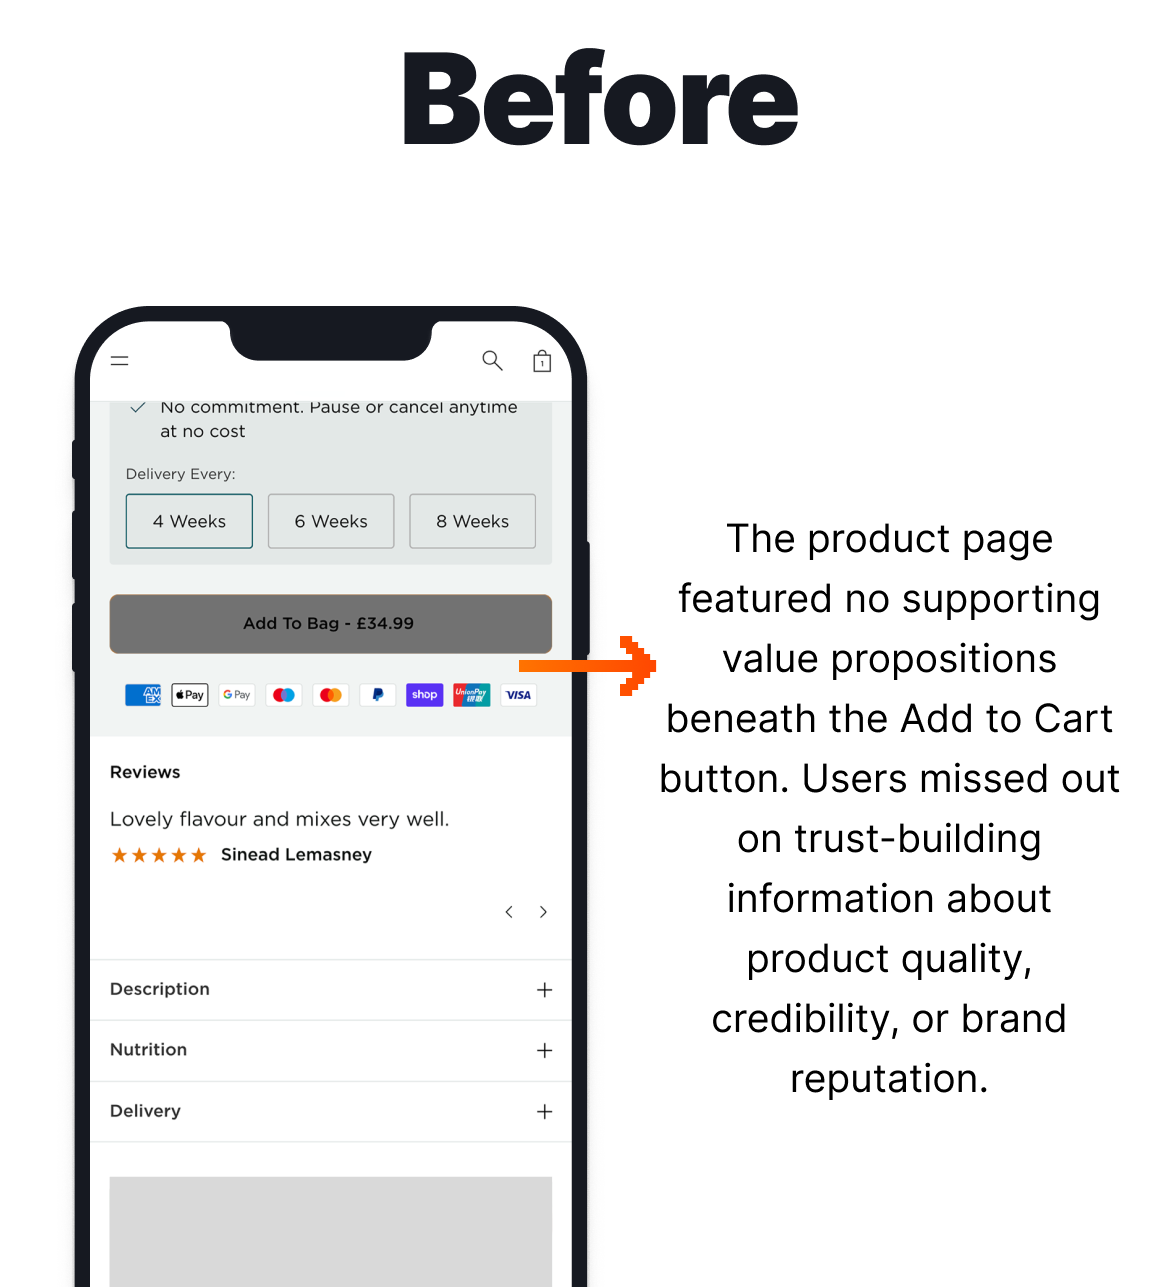
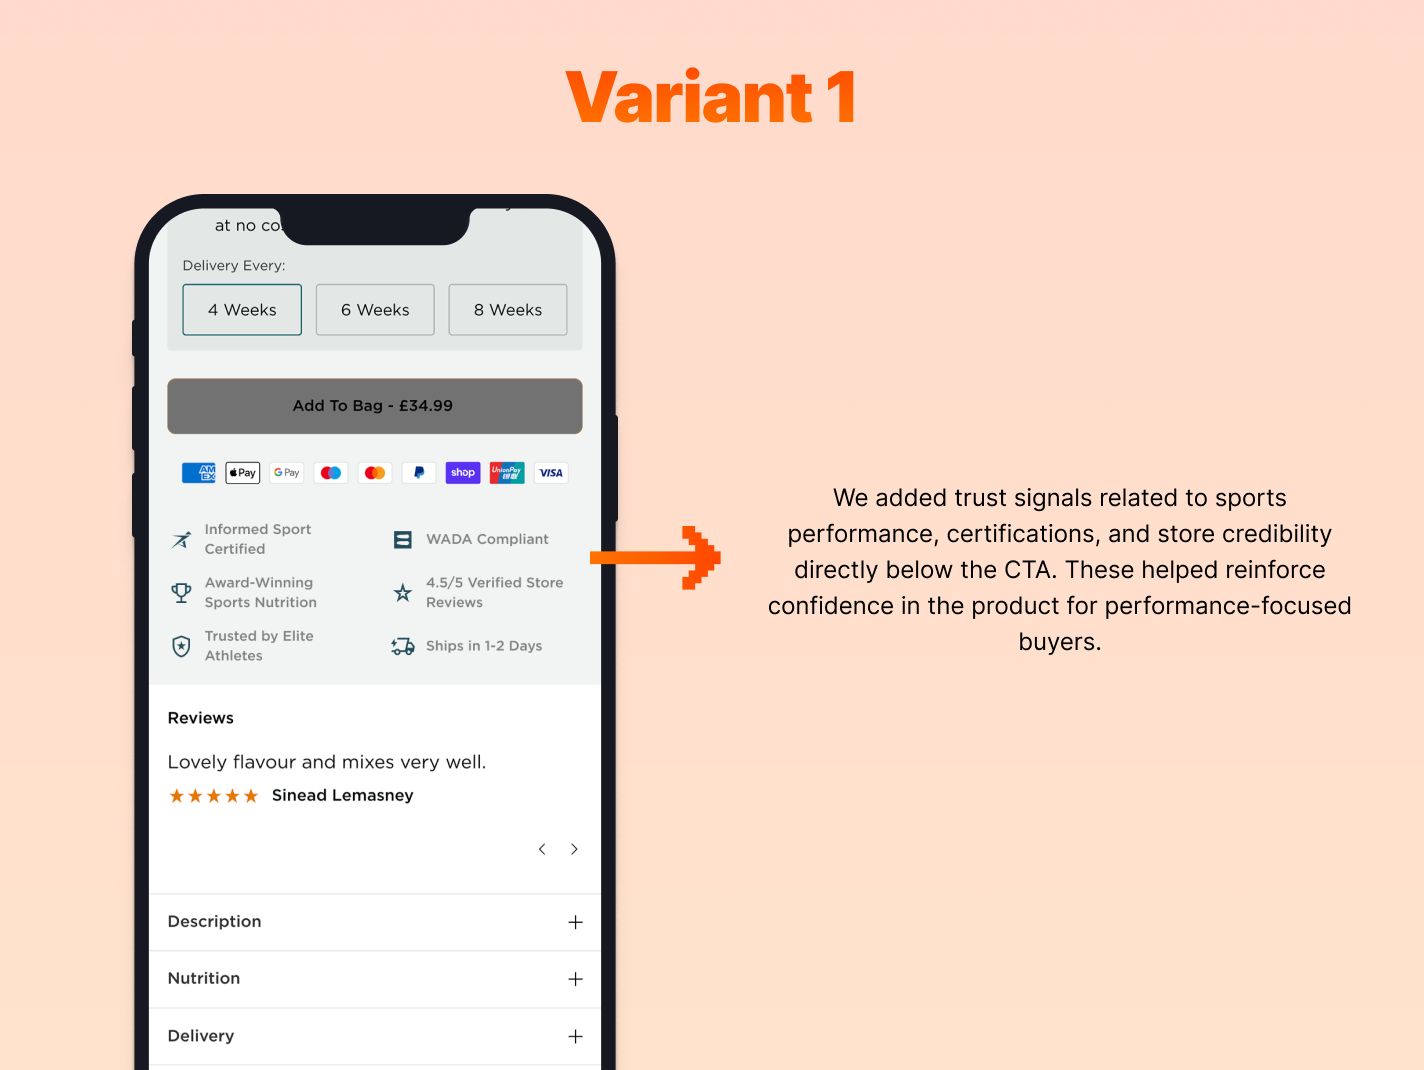
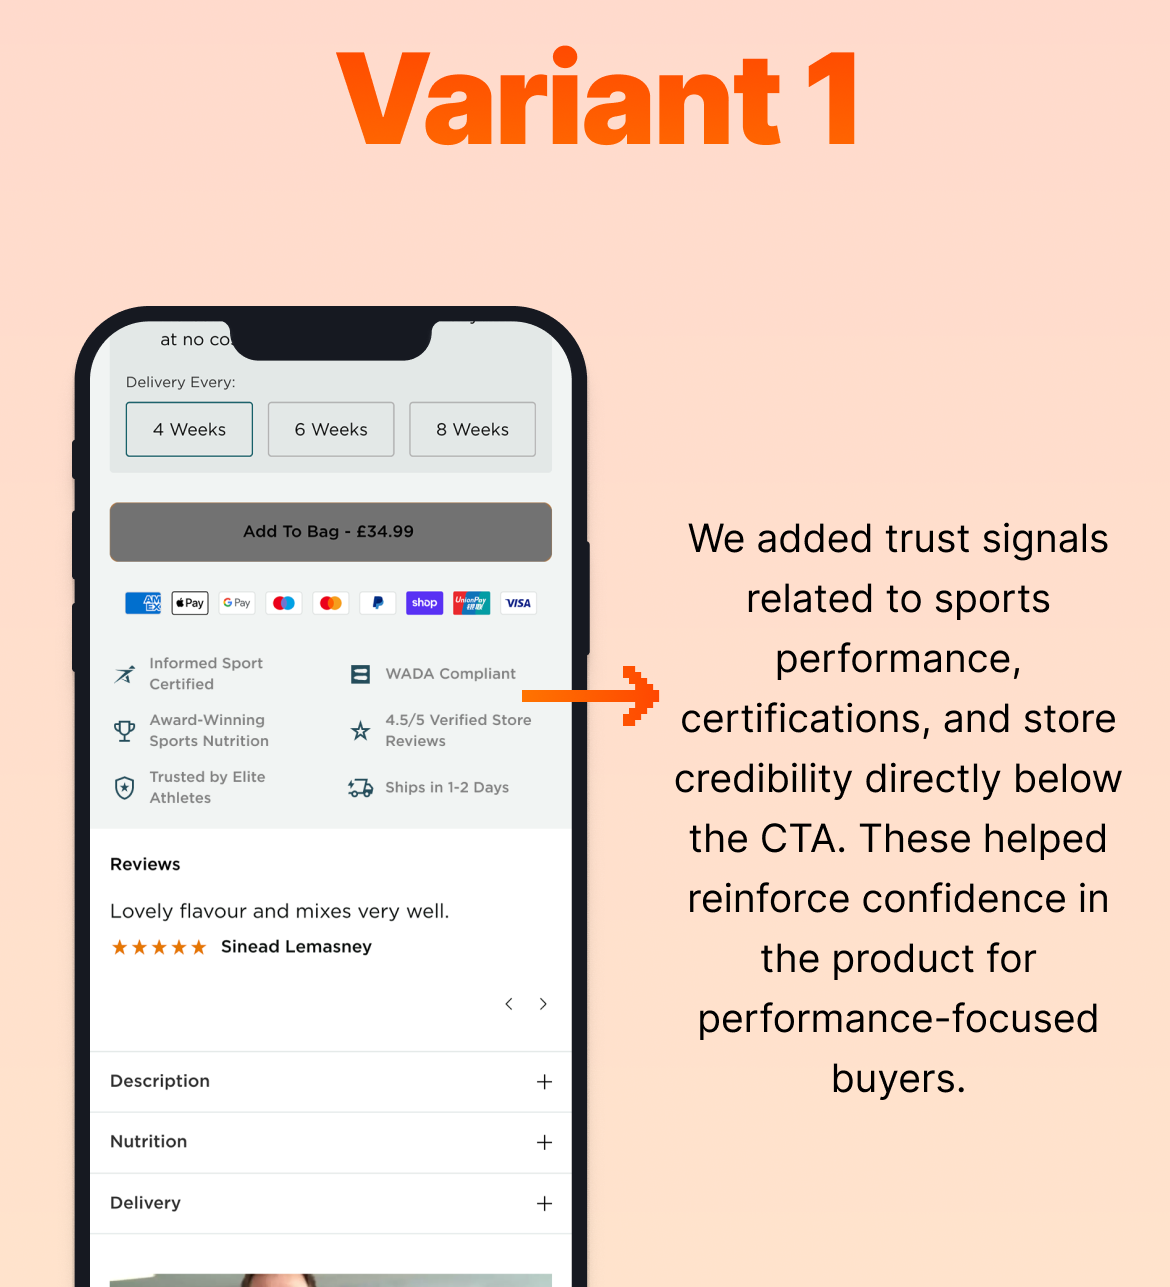
For this case, we set up an A/B/C test. Variant 1 presented the brand-based key value propositions while Variant 2 presented product-based key value propositions. We implemented this test for both the brands’ Ireland and UK sites.

The Results

When analysing the results after two weeks, we were most interested to find the vast difference between the two brands in this test. Those in the Ireland brand seemed to be more informed on the brand and products, to such an extent that it caused them not to purchase when viewing these key value propositions, or viewed it as restrictive to viewing the rest of the information they were looking for. Based on this, we reverted to the Original variation for the Ireland brand. 

However, for the UK brand, we saw a large increase in Conversions for both variations, specifically for Variant 1. Variant 2 (product-based KVPs) saw a 66.47% increase in Conversion Rate while Variant 1 (brand-based KVPs) saw an increase of 149.71% in Conversion Rate

Based on these results, we implemented Variant 1 permanently.

  • 149.71%

    Increase in Conversion Rate

Video testimonials

GET IN TOUCH

Let’s talk about your business.

5.0 on Reviews.io

GET IN TOUCH

Let’s talk about your business.